Jump to content


Photo

AAII All Time Record 70% Bearish


  • Please log in to reply
28 replies to this topic

#21 tomterrific14

tomterrific14

    Member

  • Traders-Talk User
  • 1,451 posts

Posted 08 March 2009 - 03:46 PM

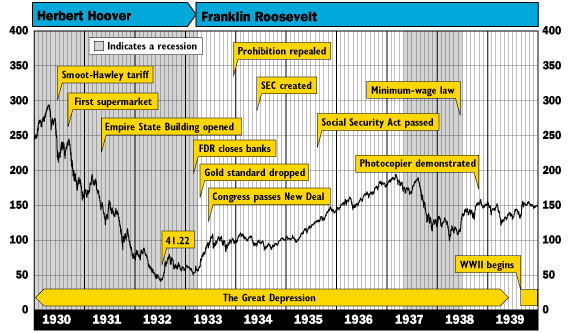
Why we stay in the game.

Note during the Great Depression -

Posted Image

The 50% return within 3 months during the 1932 rally

The 100% return within 4.4 months during the 1933 rally

The 100% return within 24 months from early '35 to early '37 rally.

Stay nimble, but watch those downdrafts :rolleyes:


So where are we now on this chart? It looks to me like we are half way through the Hoover period where the market dropped about 50 percent. We still have some distance down to travel before the bottom.

Rich


hmmm, halfway point coincided with a countertrend rally of almost 20% and the opening of the Empire State Building......parallel to today is the opening of the New Yankee Stadium....opening day is fast approaching, lol

#22 salsabob

salsabob

    Member

  • Traders-Talk User
  • 1,164 posts

Posted 08 March 2009 - 07:19 PM

Why we stay in the game.

Note during the Great Depression -

Posted Image

The 50% return within 3 months during the 1932 rally

The 100% return within 4.4 months during the 1933 rally

The 100% return within 24 months from early '35 to early '37 rally.

Stay nimble, but watch those downdrafts :rolleyes:


salsabob,

With all due respect, do not confuse charts with trading. If one flips thru the pages of the history, the most astute traders of that time were broke before those spectacular rallies in the market begun in the 30s. "Plungers and Peacocks" is a nice read on the history of that era. Today we have an army of retails suckers and value buyers, who think they will catch those bottoms. Either the information age has transformed the markets or history will repeat itself. We should know that soon.


You're absolutely right. I posted it only to show the potential.

Another aspect of this is how broad was the participation. Not only were most too broke to participate, but many of those that were not, were instead scared too 'shirtless' to get on the bus. I don't blame them; I think many of us are feeling much the same way, and those that are not, will likely be so in the future. That might be a pre-condition. ;)
John Galt shrugged, outsourced to Red China and opened a hedge fund for unregulated securitized credit derivatives.

If the world didn't suck, wouldn't we all just fly off?

#23 salsabob

salsabob

    Member

  • Traders-Talk User
  • 1,164 posts

Posted 08 March 2009 - 07:22 PM

So where are we now on this chart? It looks to me like we are half way through the Hoover period where the market dropped about 50 percent. We still have some distance down to travel before the bottom.

Rich


Know that (enough to act on it), and you will be a very rich man indeed. :)
John Galt shrugged, outsourced to Red China and opened a hedge fund for unregulated securitized credit derivatives.

If the world didn't suck, wouldn't we all just fly off?

#24 OEXCHAOS

OEXCHAOS

    Mark S. Young

  • Admin
  • 22,019 posts

Posted 08 March 2009 - 08:41 PM

I suspect that the REAL low prior to the end of this Bear will come on much LESS bearish readings from some of these measures. That said, we know that a big bump in Bearishness from this indicator has been a pretty good Buy signal. The one thing I want folks to remember is that the amount of Bearishness need not relate at all to the amount of rally one gets. It's NOT a linear relationship. (apologies if someone else articulated this in this thread. I've not had time to read it all) Mark

Mark S Young
Wall Street Sentiment
Get a free trial here:
http://wallstreetsen...t.com/trial.htm
You can now follow me on twitter


#25 tomterrific14

tomterrific14

    Member

  • Traders-Talk User
  • 1,451 posts

Posted 08 March 2009 - 09:29 PM

I suspect that the REAL low prior to the end of this Bear will come on much LESS bearish readings from some of these measures.

That said, we know that a big bump in Bearishness from this indicator has been a pretty good Buy signal.

The one thing I want folks to remember is that the amount of Bearishness need not relate at all to the amount of rally one gets. It's NOT a linear relationship.

(apologies if someone else articulated this in this thread. I've not had time to read it all)

Mark


In looking at the charted data of the AAII Sentiment survey, the amount of bullisness was the greatest at the exact top of the market in 2007 and the amount of decline has so far related to the extreme reading.....why couldn't the reverse also be true as the extent of the rally off the most bearishness in the survey.? Especially if the extremes of either sentiment reflect "bought in bulls" at the top, and "sold out bears" at the bottom.

Only fly in the ointment is , as someone here posted, bearishness readings go to 75, 80, or 90%. Or as you suspect, Mark, that the Real Low will be accompanied by less bearishness.....................

#26 OEXCHAOS

OEXCHAOS

    Mark S. Young

  • Admin
  • 22,019 posts

Posted 09 March 2009 - 06:41 AM

I suspect that the REAL low prior to the end of this Bear will come on much LESS bearish readings from some of these measures.

That said, we know that a big bump in Bearishness from this indicator has been a pretty good Buy signal.

The one thing I want folks to remember is that the amount of Bearishness need not relate at all to the amount of rally one gets. It's NOT a linear relationship.

(apologies if someone else articulated this in this thread. I've not had time to read it all)

Mark


In looking at the charted data of the AAII Sentiment survey, the amount of bullisness was the greatest at the exact top of the market in 2007 and the amount of decline has so far related to the extreme reading.....why couldn't the reverse also be true as the extent of the rally off the most bearishness in the survey.? Especially if the extremes of either sentiment reflect "bought in bulls" at the top, and "sold out bears" at the bottom.

Only fly in the ointment is , as someone here posted, bearishness readings go to 75, 80, or 90%. Or as you suspect, Mark, that the Real Low will be accompanied by less bearishness.....................


I either didn't make myself clear or I'm not reading you right. The amount of Bullishness at the top was NOT particularly extreme. Barely enough to justify looking for a correction.

It's utterly dwarfed by the Bullishness in 2004, when we were about to have a puny little correction.

In theory, Bullishness is at it's highest point at a top. In practice, it just tends to be higher at the beginning of a correction/Bear than during it. It really doesn't predict how much damage is likely to be done.

Mark S Young
Wall Street Sentiment
Get a free trial here:
http://wallstreetsen...t.com/trial.htm
You can now follow me on twitter


#27 OEXCHAOS

OEXCHAOS

    Mark S. Young

  • Admin
  • 22,019 posts

Posted 09 March 2009 - 06:49 AM

Why we stay in the game.

Note during the Great Depression -

Posted Image

The 50% return within 3 months during the 1932 rally

The 100% return within 4.4 months during the 1933 rally

The 100% return within 24 months from early '35 to early '37 rally.

Stay nimble, but watch those downdrafts :rolleyes:


So where are we now on this chart? It looks to me like we are half way through the Hoover period where the market dropped about 50 percent. We still have some distance down to travel before the bottom.

Rich


Presupposing, of course, that we're not in a much better situation than '31. How's our monetary situation compare? Fiscal stimulus? Current economic activity?

Doesn't seem too similar to me. Maybe it gets worse. It might not have to or it might. Just seems like a stretch.

Then again, if you compare the durations of the declines, we're at about the same place time wise as 6 months before the ultimate low.

Mark

Mark S Young
Wall Street Sentiment
Get a free trial here:
http://wallstreetsen...t.com/trial.htm
You can now follow me on twitter


#28 Rich

Rich

    Member

  • Traders-Talk User
  • 761 posts

Posted 09 March 2009 - 02:22 PM

Why we stay in the game.

Note during the Great Depression -

Posted Image

The 50% return within 3 months during the 1932 rally

The 100% return within 4.4 months during the 1933 rally

The 100% return within 24 months from early '35 to early '37 rally.

Stay nimble, but watch those downdrafts :rolleyes:


So where are we now on this chart? It looks to me like we are half way through the Hoover period where the market dropped about 50 percent. We still have some distance down to travel before the bottom.

Rich


Presupposing, of course, that we're not in a much better situation than '31. How's our monetary situation compare? Fiscal stimulus? Current economic activity?

Doesn't seem too similar to me. Maybe it gets worse. It might not have to or it might. Just seems like a stretch.

Then again, if you compare the durations of the declines, we're at about the same place time wise as 6 months before the ultimate low.

Mark


Of course, it is difficult, if not impossible, to tell where we are on this chart or if any of it applies to today. However, if you believe that history can tell us something about the future and you believe that a depression is likely, then looking at this chart may give you an idea of what is in store for us.

Rich

PS. My model is still short.

#29 OEXCHAOS

OEXCHAOS

    Mark S. Young

  • Admin
  • 22,019 posts

Posted 09 March 2009 - 03:00 PM

So far, you're model is dead right. Mark

Mark S Young
Wall Street Sentiment
Get a free trial here:
http://wallstreetsen...t.com/trial.htm
You can now follow me on twitter