Jump to content


Photo

Hey Bulls out there


  • Please log in to reply
42 replies to this topic

#21 Bullryder

Bullryder

    Member

  • Traders-Talk User
  • 256 posts

Posted 30 April 2009 - 12:56 PM

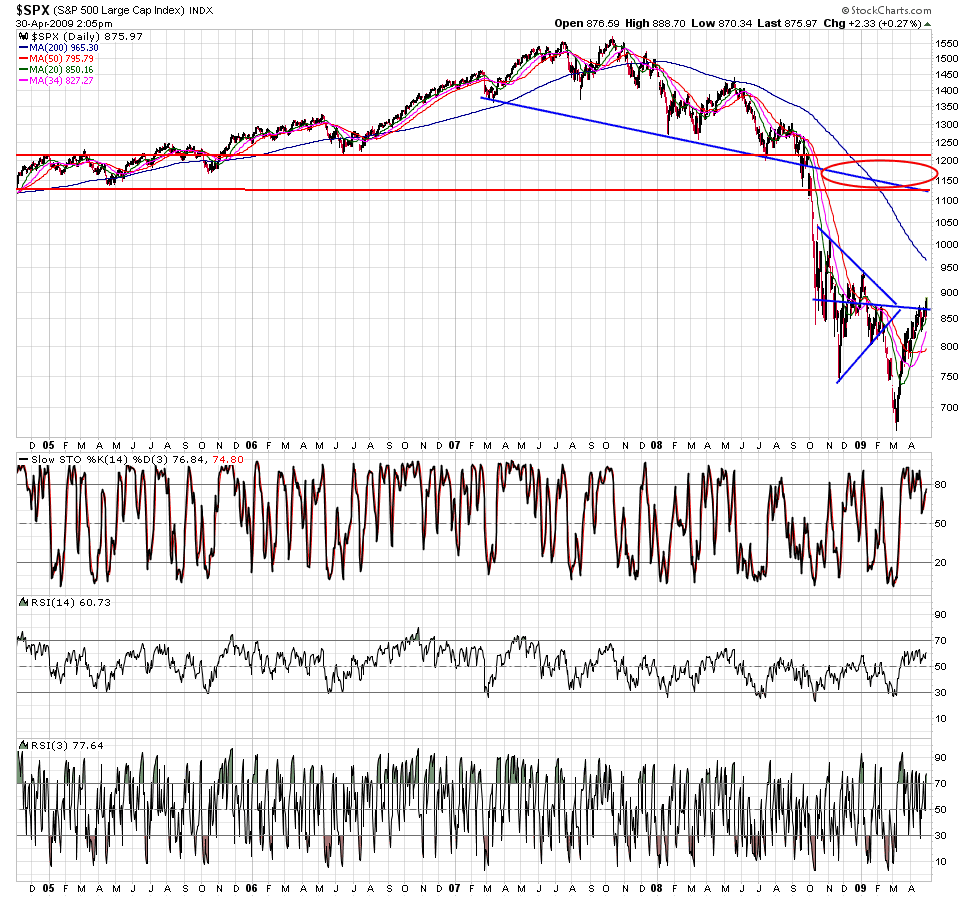
I agree TA and you can tell by listening to the cnbc traders. they keep saying everyone is skeptical and they are taking profits below that big 875 number but the market is not going down. that should tell you all you alot right there.


Yes, the high might be tomorrow. A gap up would be a gift to the bears. If it stops at 900, Moneyfriend should auction off his coffee cup.

#22 skott

skott

    Member

  • Traders-Talk User
  • 4,712 posts

Posted 30 April 2009 - 01:08 PM

Breaking thru the middle of wedge implies higher move to next resistance....Target for SPX this year SPX_Target.png

#23 MoneyFriend

MoneyFriend

    Member

  • Traders-Talk User
  • 917 posts

Posted 30 April 2009 - 01:12 PM

Breaking thru the middle of wedge implies higher move to next resistance....Target for SPX this year
SPX_Target.png


Go look at my '00-'04 chart, you will see the first wedge had a little bit of a breakthrough before it dropped. No biggy imo.
Also, not sure if stockcharts has a wedge tool w/ median line, but it's important the median is exact.

PS, I suggest all longterm charting be done on the OEX, less noise.

Edited by MoneyFriend, 30 April 2009 - 01:15 PM.


#24 skott

skott

    Member

  • Traders-Talk User
  • 4,712 posts

Posted 30 April 2009 - 01:25 PM

you might also want to look at the 2003 market Jan- March and compare to this year same months. see what happened after. trying to help you avoid a total wipe out dude but you are making it difficult

#25 MoneyFriend

MoneyFriend

    Member

  • Traders-Talk User
  • 917 posts

Posted 30 April 2009 - 01:34 PM

you might also want to look at the 2003 market Jan- March and compare to this year same months. see what happened after. trying to help you avoid a total wipe out dude but you are making it difficult


thanks for your help skott, i'm not going long here, dude.

#26 skott

skott

    Member

  • Traders-Talk User
  • 4,712 posts

Posted 30 April 2009 - 01:44 PM

but aren't you still short and down over 30%?

#27 Bullryder

Bullryder

    Member

  • Traders-Talk User
  • 256 posts

Posted 30 April 2009 - 01:51 PM

you might also want to look at the 2003 market Jan- March and compare to this year same months. see what happened after. trying to help you avoid a total wipe out dude but you are making it difficult


You need to go back a lot longer than 2003. 1929 at a minimum.

#28 MoneyFriend

MoneyFriend

    Member

  • Traders-Talk User
  • 917 posts

Posted 30 April 2009 - 01:54 PM

but aren't you still short and down over 30%?


I'm hedged with Jan 2010 UYG calls that I picked up dirt cheap on march 12th, "total wipe out" wont happen.

Edited by MoneyFriend, 30 April 2009 - 01:55 PM.


#29 skott

skott

    Member

  • Traders-Talk User
  • 4,712 posts

Posted 30 April 2009 - 01:58 PM

bullryder, there is no rule that say's we have to follow 1929 or 2003. I was citing that as an example of a timeframe and market action that closely resembles this time but more so just a warning of an example when things looked bleak and the market set up for a fall it just kept going up. There is something else that tells me this is not "the top" but I'm not giving my best tool away. hopefully the market will correct some but looking for below 600 soon is unreasonable.

#30 isaac613

isaac613

    Member

  • Traders-Talk User
  • 1,264 posts

Posted 30 April 2009 - 02:06 PM

Its 3:00 PM do you know where your money is. A close below 870 will open a wave of selling. Lady's and Gentlemen, put your seatbelts on.