Investors Intelligence Advisory Sentiment
#11

Posted 06 June 2009 - 12:38 PM
06/12/09 52% Bulls 34% Bears 1.53 ratio
This is the first reading of over 50% since December 2007!
LINK
BIGGEST SCIENCE SCANDAL EVER...Official records systematically 'adjusted'.
#12

Posted 06 June 2009 - 12:41 PM
AAII most bullish since January top! Thrift Savings likewise
AAII:
(as of 6/3/2009)
Bullish: 47.56%
Neutral: 15.85%
Bearish: 36.59%
(as of 1/7/2009)
Bullish: 48.70%
Neutral: 16.23%
Bearish: 35.06%
TSP:
06/05/09...44%...41%...1.07
01/09/09...45%...42%...1.07...SPX...890.35 = -4.45%
BIGGEST SCIENCE SCANDAL EVER...Official records systematically 'adjusted'.
#13

Posted 06 June 2009 - 12:55 PM
If I viewed the market in the context of a primary bull market, then I would wholeheartedly agree. But I don't. In my world the major top was put in a year and a half ago, and we are in a primary bear market.. Regards, DFWIW, I don't like to see big spikes in the % of Bulls in either AAII or II. That said, it's only a short-term Signal.
We're a long way away from a good sentiment set up for a major top.
http://stockcharts.com/c-sc/sc?s=$SPX&p=M&st=1980-01-28&i=p39183268817&a=149688849&r=179.png
PS- Viewed in my context, btw, Roger's point above is completely valid. In the context of a new primary bull, which I reject for TA reasons, it would not matter, like in 2003, for example. Context is everything.
Edited by IYB, 06 June 2009 - 01:03 PM.
#14

Posted 06 June 2009 - 01:19 PM
If I viewed the market in the context of a primary bull market, then I would wholeheartedly agree. But I don't. In my world the major top was put in a year and a half ago, and we are in a primary bear market.. Regards, DFWIW, I don't like to see big spikes in the % of Bulls in either AAII or II. That said, it's only a short-term Signal.
We're a long way away from a good sentiment set up for a major top.
http://stockcharts.com/c-sc/sc?s=$SPX&p=M&st=1980-01-28&i=p39183268817&a=149688849&r=179.png
PS- Viewed in my context, btw, Roger's point above is completely valid. In the context of a new primary bull, which I reject for TA reasons, it would not matter, like in 2003, for example. Context is everything.
Don,
Go back and take a look at market historical periods with a secular bear trend. Pick a secular bear period (1966-82 for example). What was the average length of a bear run? Keep in mind the recent bear run went from Oct 07 to Mar 09 or 18 or so months. Compare this bear run to historical averages in time and price. You will find it is about avg in time and more than avg in price. The ONLY exception is the great depression...we where on the gold standard then and things were MUCH different.
TA is great as are your 7 Sentinels...but in historical context there's more than a chance we are no longer in a bear. Look at the yield curve and other big picture indicators that are very seldom historically wrong. They are saying the bear phase is LIKELY (not definitely) over. Look at how the indexes are responding to the MCO. What about the summation index? The NYSE CSO A/D line is 'ok' and its A/D volume line is rocking. For goodness sake the total market A/D indicaitons are bullish confirmations of the recent run. The character of this rally is different from any market rally we've had since Oct of 2007. The leveraged financial system has 'puked up' assets by the truckload at the same time the Fed has printed a butt pile full of money. The market is going up. The ONLY thing lacking is massive NH/NL confirmations but those will be difficult given the magnitude of the bear until we move into early fall.
To change the subject...it seems like many here are Dr. Johns rather than Fat Tonys (characters from "The Black Swan"). By the way, if you haven't read "The Black Swan" I would highly recommend it. It's not a pure 'investing' book. However, it deal highly effectively with an individuals mindset WRT investing and trading.
#15

Posted 06 June 2009 - 01:49 PM
Believe me, I've spent a lifetime studying such things.http://stockcharts.com/c-sc/sc?s=$SPX&p=M&st=1980-01-28&i=p39183268817&a=149688849&r=179.pngFWIW, I don't like to see big spikes in the % of Bulls in either AAII or II. That said, it's only a short-term Signal.
We're a long way away from a good sentiment set up for a major top.
Context is everything.
Don,
Go back and take a look at market historical periods with a secular bear trend. Pick a secular bear period (1966-82 for example). What was the average length of a bear run? Keep in mind the recent bear run went from Oct 07 to Mar 09 or 18 or so months. Compare this bear run to historical averages in time and price. You will find it is about avg in time and more than avg in price.
I maintain that those who say that we are in a new primary bull market now are arguing with the evidence and the facts. They are guessing, hoping, or maybe just scared or being left behind. The evidence as shown by this chart among other data, clearly says: Primary Bear Market. When that changes, as Ross Perot used to say "I'm all ears" to your arguments.
The whole argument we are are having in this string is not about short term or Intermediate Term signals. It is about CONTEXT. Run those same arguments by me when we are above a rising 13 month (or 200 day) MA, and then you won't get any of this argument from me.
Good trading, D
Edited by IYB, 06 June 2009 - 01:58 PM.
#16

Posted 06 June 2009 - 01:54 PM
Go back and take a look at market historical periods with a secular bear trend. Pick a secular bear period (1966-82 for example). What was the average length of a bear run? Keep in mind the recent bear run went from Oct 07 to Mar 09 or 18 or so months. Compare this bear run to historical averages in time and price. You will find it is about avg in time and more than avg in price. The ONLY exception is the great depression...we where on the gold standard then and things were MUCH different.
TA is great as are your 7 Sentinels...but in historical context there's more than a chance we are no longer in a bear. Look at the yield curve and other big picture indicators that are very seldom historically wrong. They are saying the bear phase is LIKELY (not definitely) over. Look at how the indexes are responding to the MCO. What about the summation index? The NYSE CSO A/D line is 'ok' and its A/D volume line is rocking. For goodness sake the total market A/D indicaitons are bullish confirmations of the recent run. The character of this rally is different from any market rally we've had since Oct of 2007. The leveraged financial system has 'puked up' assets by the truckload at the same time the Fed has printed a butt pile full of money. The market is going up. The ONLY thing lacking is massive NH/NL confirmations but those will be difficult given the magnitude of the bear until we move into early fall.
Amen
#18

Posted 06 June 2009 - 02:45 PM
Go back and take a look at market historical periods with a secular bear trend. Pick a secular bear period (1966-82 for example). What was the average length of a bear run? Keep in mind the recent bear run went from Oct 07 to Mar 09 or 18 or so months. Compare this bear run to historical averages in time and price. You will find it is about avg in time and more than avg in price. The ONLY exception is the great depression...we where on the gold standard then and things were MUCH different.
TA is great as are your 7 Sentinels...but in historical context there's more than a chance we are no longer in a bear. Look at the yield curve and other big picture indicators that are very seldom historically wrong. They are saying the bear phase is LIKELY (not definitely) over. Look at how the indexes are responding to the MCO. What about the summation index? The NYSE CSO A/D line is 'ok' and its A/D volume line is rocking. For goodness sake the total market A/D indicaitons are bullish confirmations of the recent run. The character of this rally is different from any market rally we've had since Oct of 2007. The leveraged financial system has 'puked up' assets by the truckload at the same time the Fed has printed a butt pile full of money. The market is going up. The ONLY thing lacking is massive NH/NL confirmations but those will be difficult given the magnitude of the bear until we move into early fall.
Amen
Again it needs to be stressed that GannGlobal.com is bullish longer term, they are aguing the closest fits to this bear market all had retracements to test the lows, then they say the spx could go up to 1200 or more. So if we continue up from here, it will be breaking the pattern of the other several time periods closest in fit to now. Of course then there are people like Martin Armstrong that argue that the waterfall decline looks like the collapse of the Roman Empire, but he is now saying the stock market could go up in the long term as an inflation hedge but not before Dow 4000.
"In order to master the markets, you must first master yourself" ... JP Morgan
"Most people lose money because they cannot admit they are wrong"... Martin Armstrong
http://marketvisions.blogspot.com/
#19

Posted 06 June 2009 - 04:54 PM
To change the subject...it seems like many here are Dr. Johns rather than Fat Tonys (characters from "The Black Swan")
Fat Tony & Dr. John Page 122, 123 preview LINK
BIGGEST SCIENCE SCANDAL EVER...Official records systematically 'adjusted'.
#20

Posted 06 June 2009 - 06:38 PM
Believe me, I've spent a lifetime studying such things.http://stockcharts.com/c-sc/sc?s=$SPX&p=M&st=1980-01-28&i=p39183268817&a=149688849&r=179.pngFWIW, I don't like to see big spikes in the % of Bulls in either AAII or II. That said, it's only a short-term Signal.
We're a long way away from a good sentiment set up for a major top.
Context is everything.
Don,
Go back and take a look at market historical periods with a secular bear trend. Pick a secular bear period (1966-82 for example). What was the average length of a bear run? Keep in mind the recent bear run went from Oct 07 to Mar 09 or 18 or so months. Compare this bear run to historical averages in time and price. You will find it is about avg in time and more than avg in price.
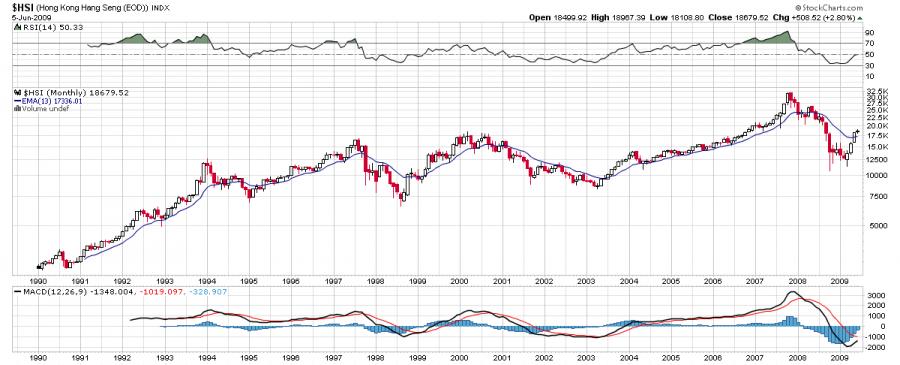
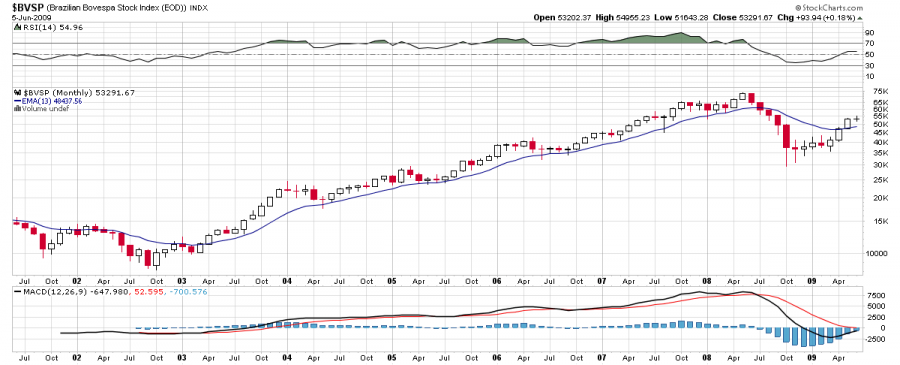
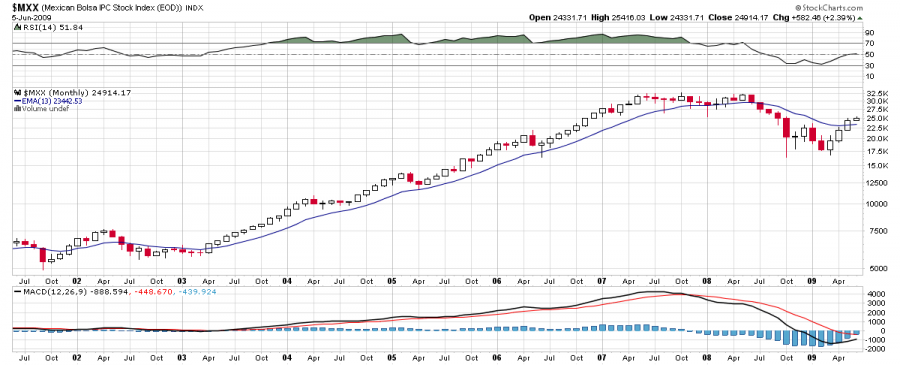
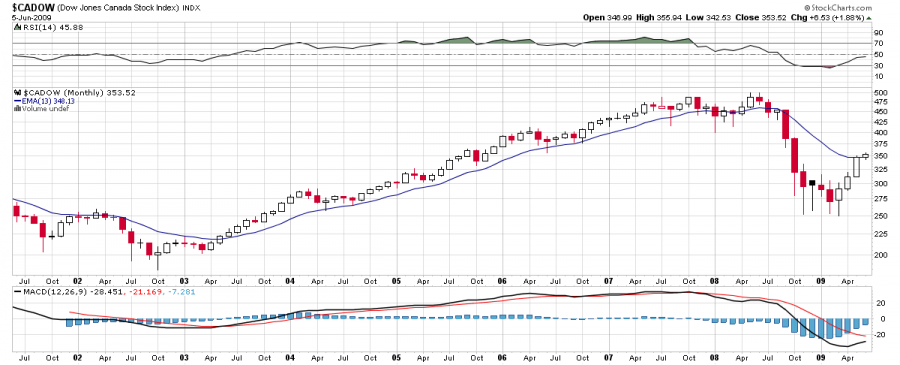
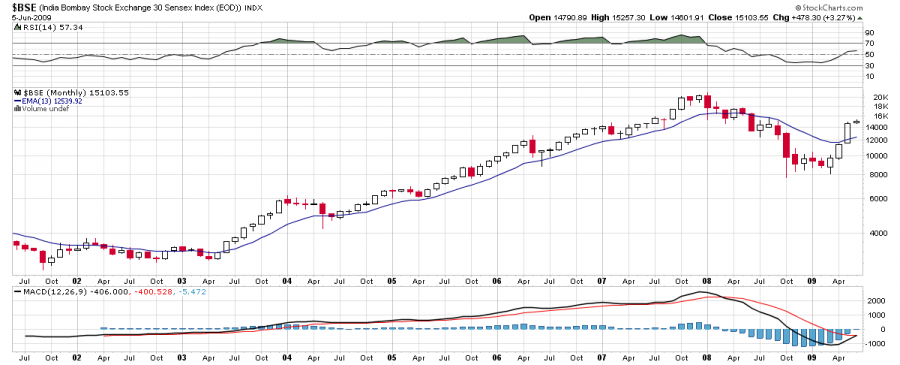
And the conclusion I reached years ago is that Context is Everything. Look, if we were above a rising 200 day/55 week/13 month moving average, we wouldn't even be having this discussion. In May of 2003, I was shouting the points made by many in this string from the rood tops. You all KNOW that. Because the context was that of a primary bull market. Because we'd had a long term base, a break through the 13 month MA and that MA had turned upward. Because the market having done the necessary work to support a primary bull trend had broken through and confirmed the new primary direction.
I maintain that those who say that we are in a new primary bull market now are arguing with the evidence and the facts. They are guessing, hoping, or maybe just scared or being left behind. The evidence as shown by this chart among other data, clearly says: Primary Bear Market. When that changes, as Ross Perot used to say "I'm all ears" to your arguments.
The whole argument we are are having in this string is not about short term or Intermediate Term signals. It is about CONTEXT. Run those same arguments by me when we are above a rising 13 month (or 200 day) MA, and then you won't get any of this argument from me.

Good trading, D
Don,
By your own metrics (200dema, 55wema, 13mema) the NDX/qqqq IS in a new bull market....right now. The NDX100 is above each of your moving avgs AND they are upward sloped! So are you calling a bull for the QQQQs? I have read recently you shorting them. The SPX was LOADED with financials which has crippled it so it's lagging IMO. The R2K is close to signaling a bull market by your measures.
In context, the price damage done by this bear run over such as short time period (Oct 08 to Mar 09) is distorting the MAs. There are plenty of other KISS indications I mentioned that argue heavily for at least the strong possibility of a new bull. The problem with using a single minded technique is they simply will not work all the time. Your method has worked in the majority of historical contexts. I even use the 50wkema and slope myself. The problem has been that this bear is ahistirical...similar to the 1973-74 bear. Again, the 55wk, 200d and 13m MA would have caused you to miss the majority of the bull run that sprang out of that one.
I'm not trying to fire up a debate with you...just trying to spur "out of your box" thinking.


