Jump to content


Photo

Jaws of Death


  • Please log in to reply
11 replies to this topic

#1 IYB

IYB

    Member

  • TT Patron+
  • 7,144 posts

Posted 07 June 2009 - 02:29 AM

Viewed together the chart of the 10 dma of the equity p/c ratio and the 10 dma of the OEX p/c ratio look like the jaws of shark, open wide and ready to de-limb his adversary. :o But seriously, if you were to compute the ratio of bottom chart reading to the top chart reading, at 2.0 this is probably the highest ratio since October 2007- the exact peak. That is to say, normally correct OEX option players are buying puts at unusually high levels while normally wrong equity players are buying calls at unusually high levels, either one a sign of trouble, but together.....well we'll just say there's blood in the water. :unsure: Just another "flag"....
“Men, it has been well said, think in herds; it will be seen that they go mad in herds, while they only recover their senses slowly, one by one.” Charles Mackay, Extraordinary Popular Delusions and the Madness of Crowds

#2 NAV

NAV

    Member

  • Traders-Talk User
  • 16,087 posts

Posted 07 June 2009 - 02:42 AM

But seriously, if you were to compute the ratio of bottom chart reading to the top chart reading, at 2.0 this is probably the highest ratio since October 2007- the exact peak


Very important point IMO. What it probably implies, falls in line with my beleif that a new bear leg is about to begin. Not just a pullback as many beleive (or a new bull as the perma bulls beleive), but another bear leg which should take out the March lows and head down far below that. I am thinking SPX 500.

"It's not the knowing that is difficult, but the doing"


https://twitter.com/Trader_NAV


#3 .Blizzard

.Blizzard

    Member

  • Traders-Talk User
  • 1,208 posts

Posted 07 June 2009 - 05:20 AM

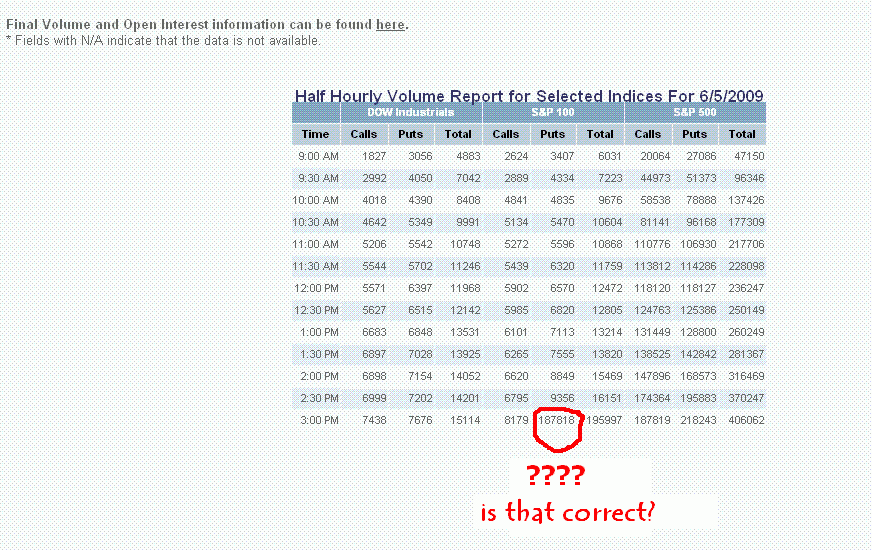
http://www.cboe.com/...ntraDayVol.aspx

Attached Thumbnails

  • OEX_put_call.gif


#4 Tor

Tor

    Member

  • Traders-Talk User
  • 7,647 posts

Posted 07 June 2009 - 05:58 AM

Great chart Don, thanks for sharing that. Very very interesting to see whats currently happening at this stage of the cycle.
Observer

The future is 90% present and 10% vision.

#5 eminimee

eminimee

    I don't care who's fur is flying...

  • TT Member
  • 14,307 posts

Posted 07 June 2009 - 06:00 AM

http://stockcharts.com/c-sc/sc?s=$VIX&p=60&yr=0&mn=1&dy=21&i=p41550391779&a=101409074&r=9149.png

#6 qqqqtrdr

qqqqtrdr

    Member

  • Traders-Talk User
  • 3,219 posts

Posted 07 June 2009 - 07:28 AM

IYB: I've been tracking the 10-day OEX Put/Call. I do have this on a mild sell.. I also use it on daily as a indication of the next day. Over the last couple of days OEX put/call has been low bringing the 10-day MA down.. If the market goes up at the same time this is considered bullish not bearish. Also, OEX 10-day is not really that high ( It would be nice if it were a little closer to 1.8 ). I'm looking for OEX Put/Call to get more bearish ( higher put/call this week ) and Equity/CBOE to be more bullish ( lower put/call this week ) as an indication this run up is topping. All this on weakening A/D..... Hope this helps.... Barry

#7 rkd80

rkd80

    Member

  • Traders-Talk User
  • 2,385 posts

Posted 07 June 2009 - 10:10 AM

Lol Tea, that is fantastic. Had no idea you were such a talented artist to boot.
“be right and sit tight”

#8 redfoliage2

redfoliage2

    Member

  • Traders-Talk User
  • 18,014 posts

Posted 07 June 2009 - 11:13 AM

Lol Tea, that is fantastic. Had no idea you were such a talented artist to boot.

rkd: You did not win that avatar, right? Or you just like it?

#9 cgnx

cgnx

    Member

  • Traders-Talk User
  • 2,103 posts

Posted 07 June 2009 - 11:42 AM

Hi IYB, What is your opinion on the gold market? Would you say it is in a bullmarket? According to your parameters? Mike G.
If it can be cornered, it will.

#10 zoropb

zoropb

    Member

  • Traders-Talk User
  • 8,392 posts

Posted 07 June 2009 - 03:20 PM

But seriously, if you were to compute the ratio of bottom chart reading to the top chart reading, at 2.0 this is probably the highest ratio since October 2007- the exact peak


Very important point IMO. What it probably implies, falls in line with my beleif that a new bear leg is about to begin. Not just a pullback as many beleive (or a new bull as the perma bulls beleive), but another bear leg which should take out the March lows and head down far below that. I am thinking SPX 500.

I am with ya NAV but thinking 450+- area before next big bounce then another leg south unless some really really wild printing goes on then that may do it.

While I am here was fooling with SPX site and as of 6-2-09 as per Div. yields 2.32% SPX should be at 300 area based on bear lows. As per earnings per share of 13.49 x 14 pe spx current value 189 and would take at peak earnings of 6% year growth for next 30 years :rolleyes: to reach our current 940 area :lol: :lol: :lol: :lol: :lol: LT bulls are delusional but quite entertaining. Like they say... ignorance is bliss.

Z

Love, be kind to one another, seek the truth, walk the narrow path between the ying and the yang.