
Short term overbought conditions not withstanding nor to be ignored, a new Primary Bull Market is underway, powered by a new intermediate term uptrend which kicked off from the July 15, 2009 Seven Sentinels Buy Signal.
Context is everything. Analysis and trading do not take place in a vacuum - they take place within a context. Analytical tools operate differently in bull market and in bear market trends. The put call ratios discussed last weekend are a prime example of this, as are VIX and VXN levels associated normally with turning points. Once the trader gets the context right and puts the wind at his back, good analysis and good decisions follow. Many will disagree and say that it really doesnt matter what we call this market. We can call it a bull, bear, zebra, monkey, or mountain goat and it changes nothing. They just want to get the next trade right, and trend definitions are meaningless. I have absolutely no quarrel with success, nor with anyone elses methods. Every trader must do what works for him or her.
For me, however, what "works" is a clear understanding of the secular, primary and intermediate term trends in place at any given time. This has been the cornerstone of my trading and analytical process, and when I am out of synch with that for three weeks, it feels like three years. But as past periods like March 2003 have taught me, by the time the real fun starts later, I'll have forgotten that I arrived at the party a few minutes late.
A quick review of how Ive viewed the context and traded this market since March: When the Seven Sentinels called the bottom on March 12, 2009 at around 700 and I switched my core position from short to long, then rode the bull trend some 30% higher to about 915. Next, I then took the Seven Sentinels Sell Signal (SSSS) of May 12, 2009 and switched my core position to short. Because the market still fit the classical definition of a primary bear market at that point, I gave the market every possible opportunity to reassert the bear market scenario as it tested the declining 13 month moving average in June and July. Many argued with me on that, and it turns out that they were right.
 But I would do the same the next time defer to the prevailing primary trend until proven otherwise. Then finally, sensing that an important change was taking place, my core position was stopped out and I stayed in 100% cash from July 23 until now.
 Meantime, I had until now set aside the Seven Sentinels Buy Signal (SSBS) of July 15, 2009 because the divergent set up had been unconvincing, and in the absence of a clear divergent set up like the one we had at the March lows, for example, I deferred to the primary bear market still in play. Ive been observing and waiting and have now come to a conclusion on both the Intermediate and the Primary Trend. I conclude that I was wrong to temporarily set aside that signal because the entire course of the primary trend has now changed with the July 15, 2009 SSBS.
Deferring to the primary bear trend, I had given this market every conceivable opportunity to disprove that Seven Sentinels Buy Signal of July 15, 2009. But the market has over and over again failed to do so. It will NOT invalidate that signal for one simple reason: That signal was and remains valid. A reversal of intermediate trend from down (or consolidation) to up was signaled on July 15, 2009 by the Seven Sentinels, and that renewed uptrend in turn has taken the market through thresholds that now put it under the classic definition of a primary bull market. Here are the seven as of July 15, 2009:
http://stockcharts.com/c-sc/sc?s=$NAMO&p=D&st=2009-01-01&en=2009-07-15&i=p00909320062&a=172148813&are=93.png
http://stockcharts.com/c-sc/sc?s=$NAMO&p=D&st=2009-01-01&en=2009-07-15&i=p00909320062&a=172148813&are=585.png
http://stockcharts.com/c-sc/sc?s=$NAHL&p=D&st=2009-01-01&en=2009-07-15&i=p95862527309&a=172148815&are=4875.png
http://stockcharts.com/c-sc/sc?s=$NYHL&p=D&st=2009-01-01&en=2009-07-15&i=p97885713203&a=172148816&are=901.png
http://stockcharts.com/c-sc/sc?s=$TRINQ&p=D&st=2009-01-01&en=2009-07-15&i=p85301450171&a=173572958&are=415.png
http://stockcharts.com/c-sc/sc?s=$TRIN&p=D&st=2009-01-01&en=2009-07-15&i=p59422381740&a=173572873&are=237.png
http://stockcharts.com/c-sc/sc?s=$BPCOMPQ&p=D&st=2009-01-01&en=2009-07-15&i=p74808204452&a=172863369&are=520.png
Additionally, having decided this in late July, I patiently waited through a correction this last week, and that correction came to an abrupt end on Friday with the jobs report. Ill document carefully several major reasons why I have now come to accept the July 15, 2009 Seven Sentinels Buy Signal as valid.
Here are the Seven Sentinel signals versus the SPX for the last 2 years. Clearly I acknowledge that I am "past-posting", in a sense, the July 15, 2009 signal, but feel that this is necessary in order to show the accurate picture. I will footnote that fact in the future.
http://stockcharts.com/c-sc/sc?s=$SPX&p=D&yr=1&mn=11&dy=0&i=p48045265779&a=161831573&are=118.png
Here are the factors that have shown what I consider being irrefutable evidence that the SSBS of July 15 was valid and that the current IT and LT trends are up:
1. The below chart shows that the 13 month moving average has been clearly and cleanly broken, powerful evidence that a new bull market is underway:
http://stockcharts.com/c-sc/sc?s=$SPX&p=M&st=1996-01-28&i=p04692368903&a=149688849&are=301.png
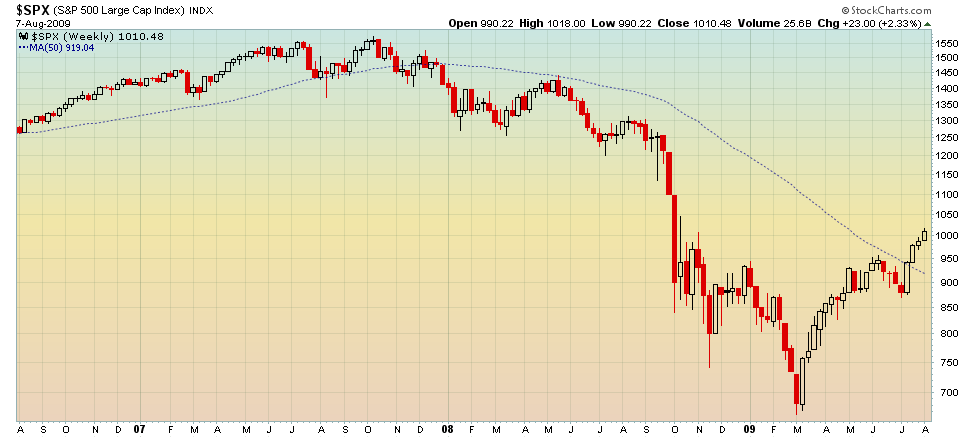
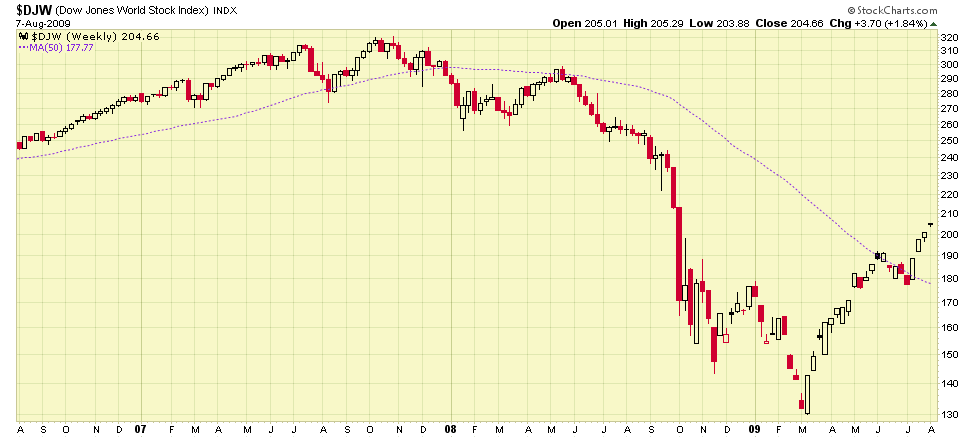
2. The new bull trend can be seen also on the unhesitating break through the 50-week moving averages as well. Shown below is not just the S&P 500, but the WORLD index, further demonstrating this new bull trend:
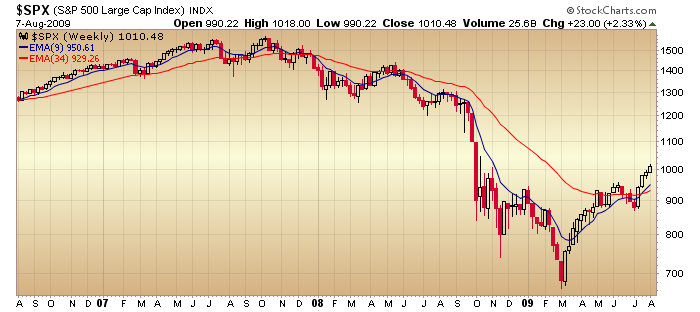
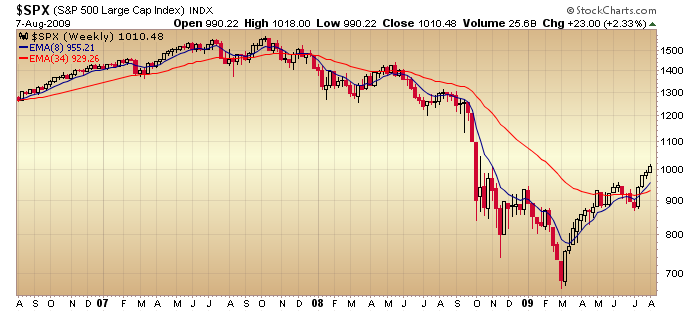
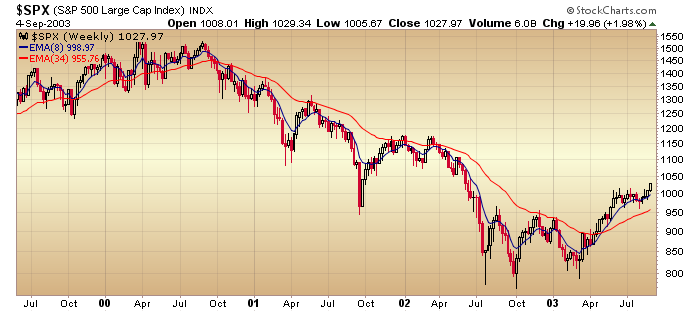
3. {Thanks to MSS and Rogerdodger for posting these earlier} The 8 week exponential moving average (EMA) of SP 500 has crossed through the 34 week EMA recently, for the first time since the last bull market ended in 2007, signaling the onset of a whole new primary bull market. It had signaled the onset of the bear market in November 2007, and until recently had stayed in bear market mode. Note that the signal is clear and unequivocal by now, whether we use the 8/34 or the 9/34 as some prefer. Below are the 2003 new bull market comparisons:

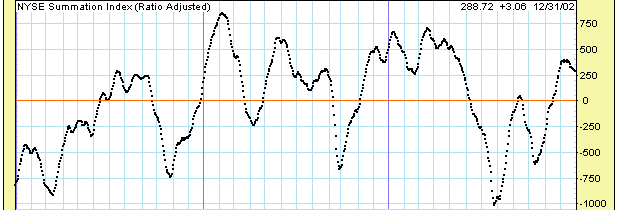
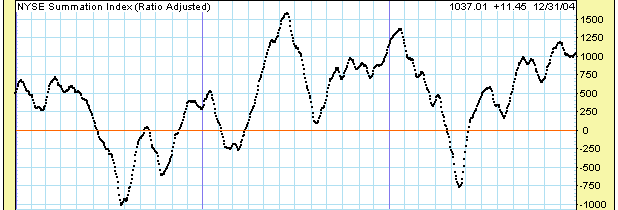
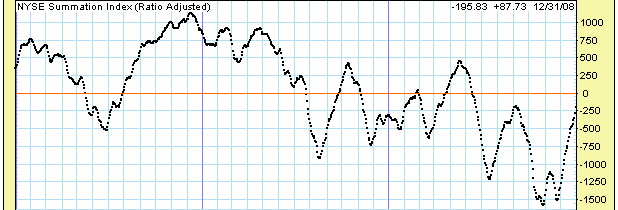
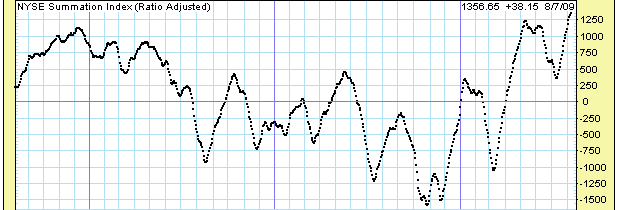
4. One excellent indicator that separates bear market rallies from bull market thrusts is the NYSE Summation Index of the McClellan Oscillator. Following are the approximate high points of this indicator in each year of this decade:
2000 +300
2001 +850
2002 +700
2003 +1550
2004 +1300
2005 +950
2006 +1120
2007 +900
2008 +480
2009 +1357 and rising, right now
2000-2002:
2002-2004:
2004-2006:
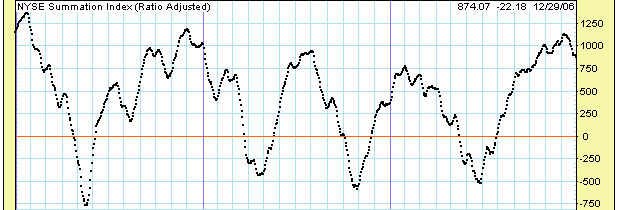
2006-2008
2008-NOW:
Charts courtesy of DecisionPoint.com
As can be seen, the last time we saw levels as high as now (and we haven't yet seen the peak) was 2003, as we entered a new Primary Bull Market. Bear market rallies in 2000, 2001, 2002, and 2008 were confined to readings under +1000. Over the years, readings over +1000, and particularly over +1250 have only been associated with primary bull markets, NOT bear market rallies. Current McO is in the +38 area, so this Summation is still rising. The charts are above for your inspection.
5. Finally, I am going to "borrow" from Carl Swenlin of Decision Point and show two other indicators that have reached bull market thrust highs already, as they continue to rise..... that have in the past been associated with new primary bull markets - further evidence that this is no Pepsi-Cola rally, but is rather "the real thing". After all, trading success doesn't just come from doing the proper research, but from knowing who's research to follow and trust, which is why, btw, I value Traders-Talk as I do:
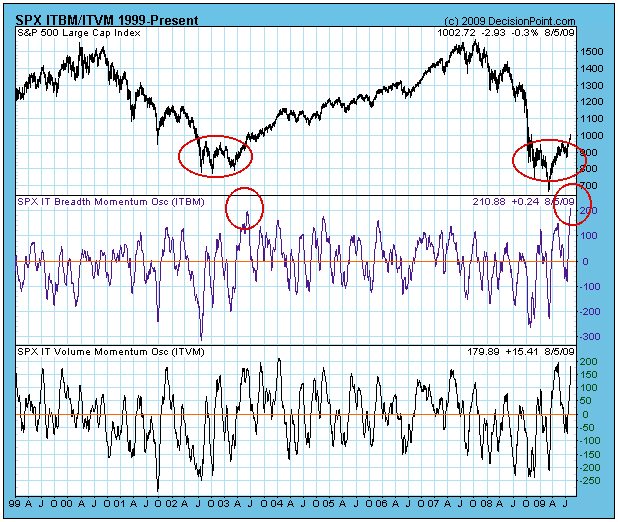
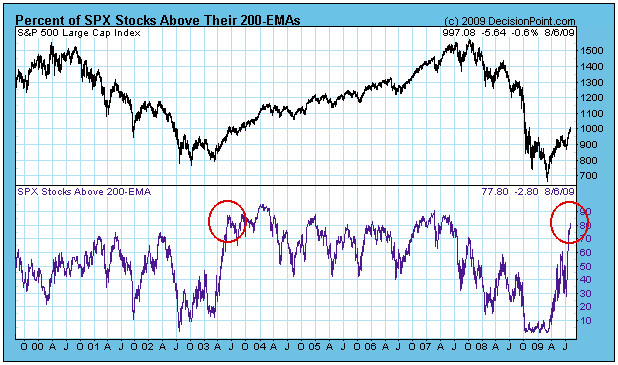
Charts courtesy of DecisionPoint.com
There are more such indicators I could show, such as the absolute level of the bullish percentages on various indices and the like, but I think the point is made and more would be redundant. The power of this thrust and the lines of demarcation that have been violated demonstrate conclusivly to this Fearless Forecaster that a new Primary Bull Market is in Play.
I know that this is a long winded post but I felt that my complete 180 degree change in market stance deserved an explanation. Good trading all, D

 . That "SSBS" signal you have posted on July now was not treated as such, you interpreted it as a sell, your system took a loss, please admit to that and mark it appropriately as a SSSS or SSFP.

 U.F.O.


