The video takes less than five minutes and shows via a chart of the 1929-32 market where it went and how, so far, this market is matching it to a "T."
http://www.youtube.c...player_embedded
Edited by milbank, 15 August 2009 - 09:20 PM.

Member
Posted 15 August 2009 - 09:14 PM
Edited by milbank, 15 August 2009 - 09:20 PM.
"The power of accurate observation is commonly called cynicism by those who have not got it."
--George Bernard Shaw
"None are so hopelessly enslaved as those who falsely believe they are free."
--Johann Wolfgang von Goethe
Member

Posted 15 August 2009 - 10:23 PM
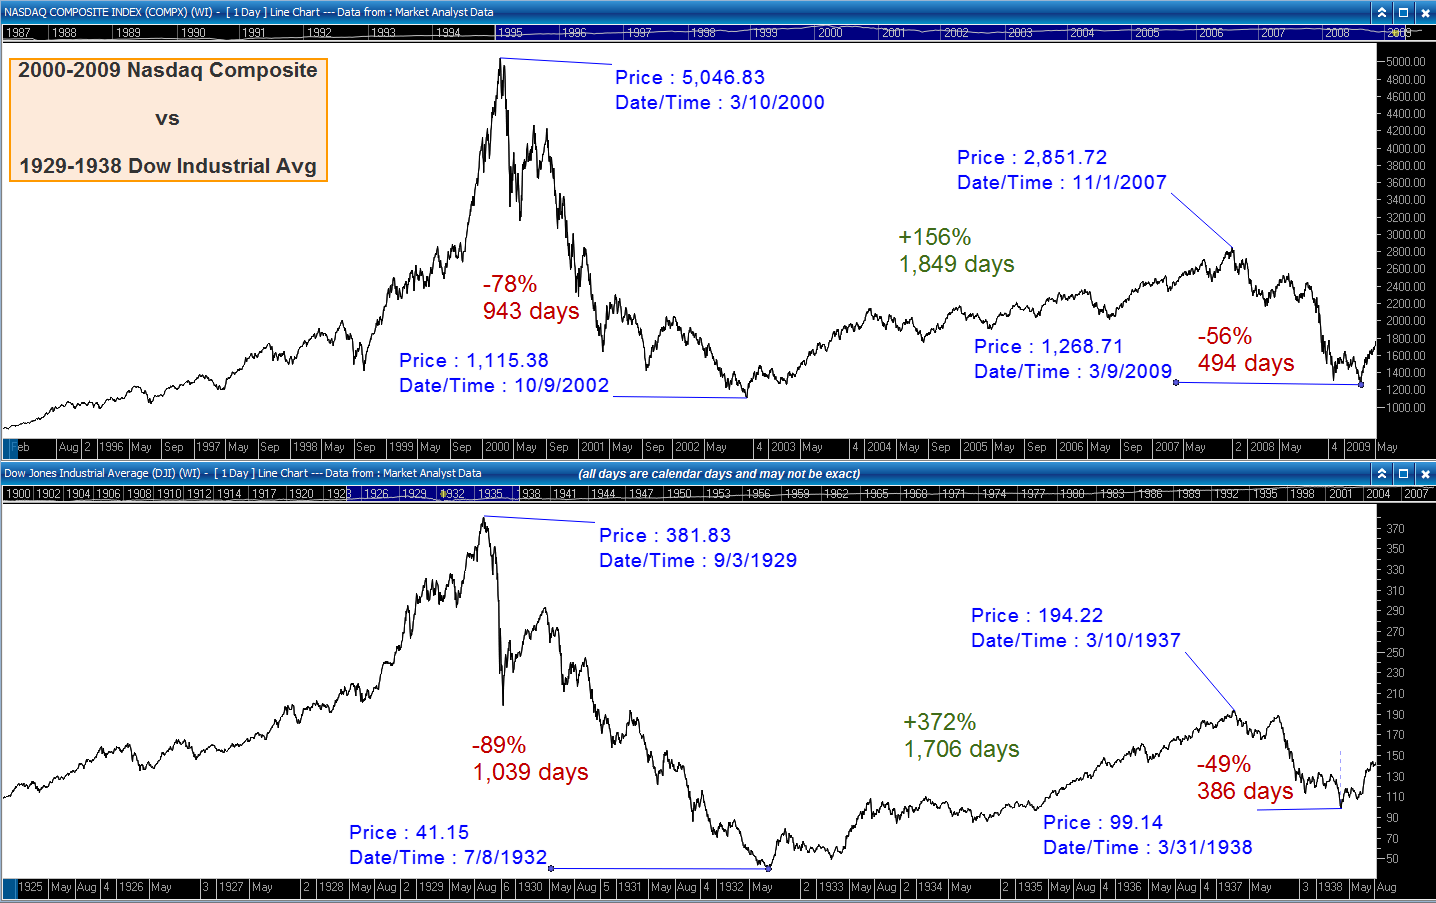
Both are 50% rallies. Ultimately the 1929 market fell a full 92%. If this was to happen this time the SPX will end up at 126 and have a PE of about 5 based on 2009 GAAP earnings. A PE under 10 is where all of the major bear markets this century eventually bottomed (1942 = PE of 9, 1951 PE=7, 1982 PE=8). At a PE=10 the SPX will be under 300 assuming EPS holds. Also, from the peak in 1930, the bottom came 27 months later in July 1932. I'm not saying the markets are going all the way to these numbers, just doing the math.
The video takes less than five minutes and shows via a chart of the 1929-32 market where it went and how, so far, this market is matching it to a "T."
http://www.youtube.c...player_embedded
Member
Posted 15 August 2009 - 10:42 PM
"The power of accurate observation is commonly called cynicism by those who have not got it."
--George Bernard Shaw
"None are so hopelessly enslaved as those who falsely believe they are free."
--Johann Wolfgang von Goethe
Member

Posted 15 August 2009 - 11:16 PM
Member

Posted 15 August 2009 - 11:52 PM
mdgcapital@protonmail.com
papilioinvest.com
@papilioinvest
"One soul is worth more than the whole world."
Patterns-based Trader and Investor in ETFs and Futures

Posted 16 August 2009 - 12:06 AM

Member

Posted 16 August 2009 - 12:10 AM
Member
Posted 16 August 2009 - 12:17 AM
I guess everyone still wants to ignore this, huh?
mdgcapital@protonmail.com
papilioinvest.com
@papilioinvest
"One soul is worth more than the whole world."
Member
Posted 16 August 2009 - 12:22 AM
There are major differences between now and 1929, the big rally in the video from in 29 came from a much higher level than we are at now, the 29 chart looks like it had only fallen less than 25% whereas in march of this year the spx had already fallen over 50%.
mdgcapital@protonmail.com
papilioinvest.com
@papilioinvest
"One soul is worth more than the whole world."
Patterns-based Trader and Investor in ETFs and Futures
Posted 16 August 2009 - 12:26 AM
I guess everyone still wants to ignore this, huh?
So, you expect the Nasdaq to top here and retest the lows...
Edited by alysomji, 16 August 2009 - 12:28 AM.


