Jump to content


Photo

Bear Market Rally 2009 vs. 1930


  • Please log in to reply
25 replies to this topic

#11 MikeyG

MikeyG

    Member

  • Traders-Talk User
  • 2,850 posts

Posted 16 August 2009 - 12:30 AM

I guess everyone still wants to ignore this, huh? :)


So, you expect the Nasdaq to top here and retest the lows...


Can you tell me where I said that? Thanks

It's always good to have someone else tell you what you've said in the past


P.S. I've already communicated my views on the above fractal in an earlier thread I made this month


I say that becasue you are comparing the two correct, btw I like the comparison...

But if you extend the chart out four years the Dow fell about 40% from late 1938(where you end the chart) to 1942

mdgcapital@protonmail.com  

papilioinvest.com

@papilioinvest


"One soul is worth more than the whole world." 


#12 inamosa

inamosa

    Patterns-based Trader and Investor in ETFs and Futures

  • Traders-Talk User
  • 1,638 posts

Posted 16 August 2009 - 12:35 AM

Here you go Mikey:
http://www.traders-t...howtopic=104508
http://www.traders-t...howtopic=109792


Here's another one for you giving my recent take (see response to punter):
http://www.traders-t...howtopic=110017
"Our job is not to predict where the market will go, but to interpret daily price and volume action to ascertain the facts of the current environment and make decisions based on that interpretation."
-Scott O'Neil (son of William O'Neil), Portfolio Manager at O’Neil Data Systems, when asked where the Dow would go in the coming months

#13 milbank

milbank

    Member

  • TT Patron+
  • 4,714 posts

Posted 16 August 2009 - 12:35 AM

I guess everyone still wants to ignore this, huh? :)


With the Naz comparison, this runup ends in October, drops into April 2010 runs up again from a higher low and then drops into 2013 around approximately the 600 area. So, the lower low will come four years after this last low which will be early spring 2013 (1938=2009, 1942=2013).

alysomji, The Dow isn't there yet but, Tthe S&P has risen 50% from the March low, no?

Edited by milbank, 16 August 2009 - 12:43 AM.

"The power of accurate observation is commonly called cynicism by those who have not got it."
--George Bernard Shaw


"None are so hopelessly enslaved as those who falsely believe they are free."
--Johann Wolfgang von Goethe


#14 inamosa

inamosa

    Patterns-based Trader and Investor in ETFs and Futures

  • Traders-Talk User
  • 1,638 posts

Posted 16 August 2009 - 12:39 AM

I guess everyone still wants to ignore this, huh? :)


With the Naz comparison, this runup ends in October, drops into April 2010 runs up again from a higher low and then drops into 2013 around approximately the 600 area. So, the lower low will come four years after this last low which will be early spring 2013 (1938=2009, 1942=2013).


No point trying it to summarize it when it's already been summarized (graphic from one of the second thread link I gave to Mikey):
Posted Image
"Our job is not to predict where the market will go, but to interpret daily price and volume action to ascertain the facts of the current environment and make decisions based on that interpretation."
-Scott O'Neil (son of William O'Neil), Portfolio Manager at O’Neil Data Systems, when asked where the Dow would go in the coming months

#15 milbank

milbank

    Member

  • TT Patron+
  • 4,714 posts

Posted 16 August 2009 - 12:46 AM

That post of yours wasn't up when I was typing my post alysomji or I would not have wasted my time doing the post.

"The power of accurate observation is commonly called cynicism by those who have not got it."
--George Bernard Shaw


"None are so hopelessly enslaved as those who falsely believe they are free."
--Johann Wolfgang von Goethe


#16 Russ

Russ

    Member

  • Traders-Talk User
  • 7,193 posts

Posted 16 August 2009 - 01:11 AM

Above comparison is interesting, Terry Laundry's T theory is looking for a high this Oct. (which is also what I am seeing) then I see a low coming in March/April (not sure about Terry on this but probably), to be followed by a bigger T theory high in summer 2010 and then the final low that I see in mid 2014 (Terry sees 2013-13), mine projection is a bit farther out than the above but all three projections are pretty close.

Terry thinks now looks closer to the 1800's and has produced a long term chart showing why, the chart can be found on my blog or over at Terry's T theory site.

The Kress 60 year cycle is calling for a 2014 low as well...

http://www.safehaven.../droke/4966.gif

Some may have seen all of this before but for those who have not, have a look.
"Nulla tenaci invia est via" - Latin for "For the tenacious, no road is impossible".
"In order to master the markets, you must first master yourself" ... JP Morgan
"Most people lose money because they cannot admit they are wrong"... Martin Armstrong


http://marketvisions.blogspot.com/

#17 inamosa

inamosa

    Patterns-based Trader and Investor in ETFs and Futures

  • Traders-Talk User
  • 1,638 posts

Posted 16 August 2009 - 09:31 AM

That post of yours wasn't up when I was typing my post alysomji or I would not have wasted my time doing the post.


No worries mate

Further discussion can be found here: http://www.traders-t...howtopic=109792
"Our job is not to predict where the market will go, but to interpret daily price and volume action to ascertain the facts of the current environment and make decisions based on that interpretation."
-Scott O'Neil (son of William O'Neil), Portfolio Manager at O’Neil Data Systems, when asked where the Dow would go in the coming months

#18 goldswinger

goldswinger

    Member

  • Traders-Talk User
  • 2,612 posts

Posted 16 August 2009 - 10:10 AM

Above comparison is interesting, Terry Laundry's T theory is looking for a high this Oct. (which is also what I am seeing) then I see a low coming in March/April (not sure about Terry on this but probably), to be followed by a bigger T theory high in summer 2010 and then the final low that I see in mid 2014 (Terry sees 2013-13), mine projection is a bit farther out than the above but all three projections are pretty close.

Terry thinks now looks closer to the 1800's and has produced a long term chart showing why, the chart can be found on my blog or over at Terry's T theory site.

The Kress 60 year cycle is calling for a 2014 low as well...

http://www.safehaven.../droke/4966.gif

Some may have seen all of this before but for those who have not, have a look.


I think the Kress cycles refer to the economy, so the market itself may bottom in 2013 ahead of the economic bottom.....

GS.

#19 VolPivots

VolPivots

    Member

  • Chartist
  • 3,203 posts

Posted 16 August 2009 - 10:23 AM

That post of yours wasn't up when I was typing my post alysomji or I would not have wasted my time doing the post.


No worries mate

Further discussion can be found here: http://www.traders-t...howtopic=109792

hey nice work, alysomji....missed this before so thx for reposting!

another to consider...using more recent history:
ScreenHunter_06_Aug._16_10.01.gif ScreenHunter_07_Aug._16_10.01.gif gif]

Edited by marketneutral, 16 August 2009 - 10:25 AM.


#20 Kimston

Kimston

    Member

  • Traders-Talk User
  • 604 posts

Posted 16 August 2009 - 10:59 AM

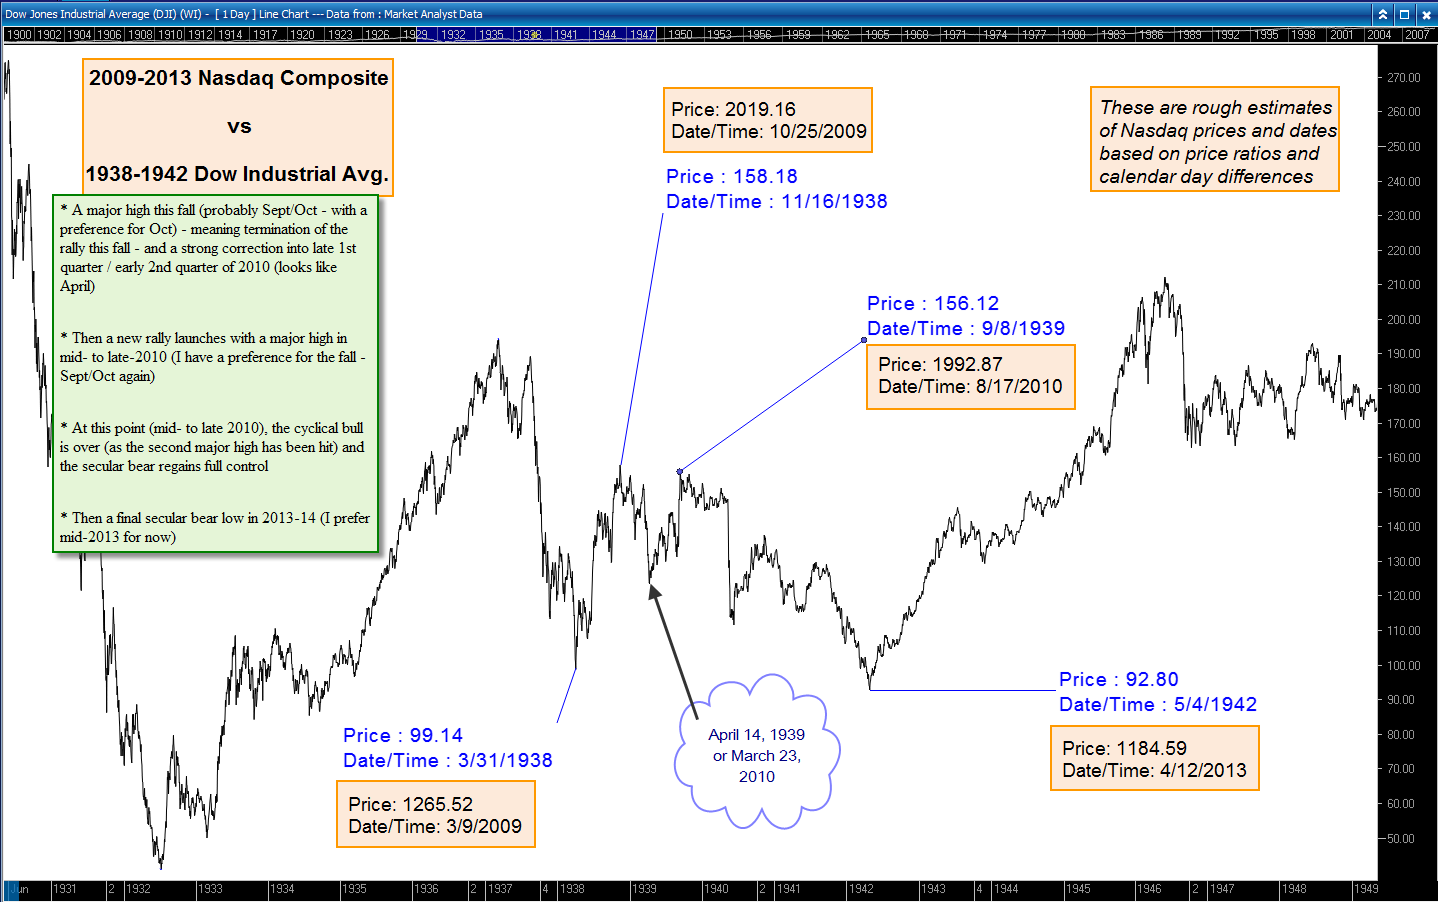
In my opinion the 1937-42 market is nothing like the current market position, looking at the big picture from an Elliot Wave [Theory] perspective. The 1932 low kicked of the start of a new super cycle bull market after the 29-32 super cycle degree bear market. 37-42 was an ABC correction of the 32-37 wv 1 rally (wv B was a triangle from 38-41 between the A and C impulse waves down). The 37-42 ABC lows held well above the 1932 low. The 2007-09 move down was a very clear 5 wv pattern in my opinion (just as the the initial leg down in 29 was 5 waves). According to E-Wave Theory, there will be another 5 wvs down to new lows after the current correction has run its course (as it did after the 29-30 correction ran its course). I think the probabilities are very high that this will occur, so our March 2009 low was not the equivalent of the 1932 low as is more like the 11/13/29 low. The difficulty is determining when the upward correction is complete because there are so many forms corrective patterns can take (zig-zag, double or triple zig-zag, flat, irregular flat, triangle, etc. - 13 types documented under the theory). We are either in a wv 2 or wv B correction of the 5 wv decline from 2007 top, either label implies the same thing: after the corrective pattern is complete, there should be a move to significantly lower lows than the Mar 2009 low. If the current correction turns out to be a flat or a wv B triangle, it could very easily chop sideways until April 2010. If current correction is a simple zig-zag, we will likely be making significant new lows later this year. The next impulse wave down will likely be an extended wave similar to 1930-32 wave, but will likely run longer. The bear market that started in 2007 is likely correcting the entire 5 wave advance from the 1932 lows, so it should take years. A 4-yr cycle low is due in 3rd or 4th quarter of 2010 which should bring prices substantially lower than current levels. I'm accumulating some Dec 2010 puts on this rally for a core short position. This strategy worked well for me in Oct-Dec 2007 period when I accumulated long-term puts for core short. Don't know if it will work this time, but I think the probabilities are there. Kimston