 If BDI reverses and rises crude can rise, but this is usually delayed by a couple of weeks...
I'm going to try a correlate the 9 week direction of $SSEC and $BDI to use as a possible future direction of $SPX. Currenly $SSEC is equal to what it was 9 weeks ago, and $BDI is consistently falling. If Shanghi starts falling again, $SPX should follow suite this time......
Comments and Criticism welcome...
Barry
If BDI reverses and rises crude can rise, but this is usually delayed by a couple of weeks...
I'm going to try a correlate the 9 week direction of $SSEC and $BDI to use as a possible future direction of $SPX. Currenly $SSEC is equal to what it was 9 weeks ago, and $BDI is consistently falling. If Shanghi starts falling again, $SPX should follow suite this time......
Comments and Criticism welcome...
Barry

Baltic Dry Index - Research
Started by
qqqqtrdr
, Aug 21 2009 10:28 PM
9 replies to this topic
#1

qqqqtrdr
-
- Traders-Talk User
- 3,219 posts
Member
Posted 21 August 2009 - 10:28 PM
Hello All:
Since there has been talk about the Baltic Dry Index and it correlation to stocks, oil, commodities, etc... I decided to take a close look at a variety indicies and compared it to the Baltic Dry Index.
I considered it a rubberband theory... The Baltic Dry Index seems to on average lead in price by 2 weeks for Oil, and 4 weeks for stock market indicies.
I noticed that Baltic Dry Index was more closely correlated to oil. When using Baltic Dry Index it seems that any indicies could could diverge for a matter of 6 weeks, then it follows the direction of Baltic Dry Index... It could be used to see if the market will continue higher or is ready for a turn.
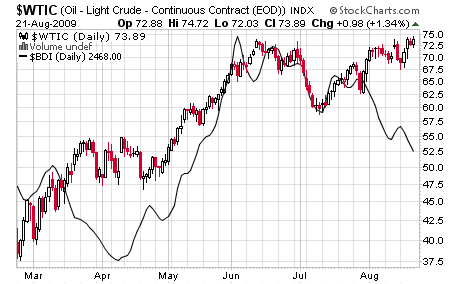
Here I show how OIL is corresponding to BDI... We have had a divergence for about 6 weeks with OIL and BDI... If my calculations are correct. We should have OIL start to retreat pretty sharply, especially if BDI continues to Fall.
 If BDI reverses and rises crude can rise, but this is usually delayed by a couple of weeks...
I'm going to try a correlate the 9 week direction of $SSEC and $BDI to use as a possible future direction of $SPX. Currenly $SSEC is equal to what it was 9 weeks ago, and $BDI is consistently falling. If Shanghi starts falling again, $SPX should follow suite this time......
Comments and Criticism welcome...
Barry
If BDI reverses and rises crude can rise, but this is usually delayed by a couple of weeks...
I'm going to try a correlate the 9 week direction of $SSEC and $BDI to use as a possible future direction of $SPX. Currenly $SSEC is equal to what it was 9 weeks ago, and $BDI is consistently falling. If Shanghi starts falling again, $SPX should follow suite this time......
Comments and Criticism welcome...
Barry
#2
Slothrop
-

- TT Member
- 625 posts
Member
Posted 21 August 2009 - 10:32 PM
I like it. Keep us posted on the results. I'm short one of the shippers.
#3
liberatorium
-

- Traders-Talk User
- 208 posts
Member
Posted 22 August 2009 - 05:04 AM
the baltic is showing a bearish development and closed the week at critical support.
the ema's merely touched, not crossing, before bending down again. opposite of last spring.
BDI Futures
Fixtures & Bloomberg World
Lloyd's
US Rail
http://stockcharts.com/c-sc/sc?s=$BDI&p=W&b=5&g=0&i=p36042209557&a=172908738&are=2773.png
http://stockcharts.com/c-sc/sc?s=$CRB&p=W&b=5&g=0&i=p72233497477&a=172909099&are=5605.png
http://stockcharts.com/c-sc/sc?s=$SSEC&p=D&b=5&g=0&i=p34614332555&a=172907165&are=7409.png
http://stockcharts.com/c-sc/sc?s=$SSEC&p=W&b=5&g=0&i=p99392493198&a=172907206&are=7914.png
"The issue which has swept down the centuries and which will have to
be fought sooner or later is the people versus the banks." Lord Acton
be fought sooner or later is the people versus the banks." Lord Acton
#4
Russ
-

- Traders-Talk User
- 7,193 posts
Member
Posted 22 August 2009 - 08:09 AM
http://stockcharts.com/c-sc/sc?s=$SPX&p=W&b=5&g=0&i=p53840282932&are=3253.png
Edited by Russ, 22 August 2009 - 08:11 AM.
"Nulla tenaci invia est via" - Latin for "For the tenacious, no road is impossible".
"In order to master the markets, you must first master yourself" ... JP Morgan
"Most people lose money because they cannot admit they are wrong"... Martin Armstrong
http://marketvisions.blogspot.com/
"In order to master the markets, you must first master yourself" ... JP Morgan
"Most people lose money because they cannot admit they are wrong"... Martin Armstrong
http://marketvisions.blogspot.com/
#5
Russ
-
- Traders-Talk User
- 7,193 posts
Member
Posted 22 August 2009 - 08:14 AM
Was not able to get words onto last post. Spx should go up to the 1200 area before more trouble.
"Nulla tenaci invia est via" - Latin for "For the tenacious, no road is impossible".
"In order to master the markets, you must first master yourself" ... JP Morgan
"Most people lose money because they cannot admit they are wrong"... Martin Armstrong
http://marketvisions.blogspot.com/
"In order to master the markets, you must first master yourself" ... JP Morgan
"Most people lose money because they cannot admit they are wrong"... Martin Armstrong
http://marketvisions.blogspot.com/
#6
qqqqtrdr
-
- Traders-Talk User
- 3,219 posts
Member
Posted 22 August 2009 - 08:26 AM
Was not able to get words onto last post. Spx should go up to the 1200 area before more trouble.
Why Russ... I'm seeing some topping indicators. 92% of S&P stocks are above their 50-day MA... We are seeing CVI at 75.... We are also seeing 10-day CPCE 10-day below .60. I'm not saying your wrong here, but it does not look like we break higher on Monday, because of too much headwind... With that said we should drop back lower from here at least in the short term, to negative some overbought tendencies.....
Looking at BDI it also supports at least a lateral move for awhile before we break higher....... If BDI continues on it's downward path it should put more pressure to the downside....
What's the points in your TA with backup that support 1200 before trouble.
Barry
#7
Russ
-
- Traders-Talk User
- 7,193 posts
Member
Posted 22 August 2009 - 02:36 PM
Was not able to get words onto last post. Spx should go up to the 1200 area before more trouble.
Why Russ... I'm seeing some topping indicators. 92% of S&P stocks are above their 50-day MA... We are seeing CVI at 75.... We are also seeing 10-day CPCE 10-day below .60. I'm not saying your wrong here, but it does not look like we break higher on Monday, because of too much headwind... With that said we should drop back lower from here at least in the short term, to negative some overbought tendencies.....
Looking at BDI it also supports at least a lateral move for awhile before we break higher....... If BDI continues on it's downward path it should put more pressure to the downside....
What's the points in your TA with backup that support 1200 before trouble. Barry
Look at the waterfall decline from last autumn, the market fell straight down with small volume, that area is untested and the market can easily just slide right up there before hitting resistance around that 1200 area which is where the downtrendline from 2007 is. As well, my oscillator is pointing at Oct for the final high which is in agreement with Terry Laundry's T theory. Then look for another big low next March/April. from my blog... http://1.bp.blogspot...re Aug 2009.gif
Vix is also pointing at an Oct high with its big diagonal triangle, triangle theory suggests the final break-out of the formation around the 80% area which takes it into Oct. http://1.bp.blogspot... oct 09 low.gif
Edited by Russ, 22 August 2009 - 02:42 PM.
"Nulla tenaci invia est via" - Latin for "For the tenacious, no road is impossible".
"In order to master the markets, you must first master yourself" ... JP Morgan
"Most people lose money because they cannot admit they are wrong"... Martin Armstrong
http://marketvisions.blogspot.com/
"In order to master the markets, you must first master yourself" ... JP Morgan
"Most people lose money because they cannot admit they are wrong"... Martin Armstrong
http://marketvisions.blogspot.com/
#8
Russ
-
- Traders-Talk User
- 7,193 posts
Member
Posted 22 August 2009 - 03:15 PM
"Nulla tenaci invia est via" - Latin for "For the tenacious, no road is impossible".
"In order to master the markets, you must first master yourself" ... JP Morgan
"Most people lose money because they cannot admit they are wrong"... Martin Armstrong
http://marketvisions.blogspot.com/
"In order to master the markets, you must first master yourself" ... JP Morgan
"Most people lose money because they cannot admit they are wrong"... Martin Armstrong
http://marketvisions.blogspot.com/
#9
laza
-

- Traders-Talk User
- 128 posts
Member
Posted 22 August 2009 - 03:59 PM
Inverse H&S targets 1200 or more.What's the points in your TA with backup that support 1200 before trouble.
Someone posted a price-volume chart with an air gap till 1200.
I personally think TA is moot at this point. This thing's going up cuz banks (via the Fed) are pouring money into it. Their balance sheets demand replenishment of equity and the Fed is accommodating. Demand isn't real, though; banks are just ramping on the backs of short-covering....which causes underperforming long-only funds to jump in. Thanks to us shorts, we're on a moon shot.
#10
qqqqtrdr
-
- Traders-Talk User
- 3,219 posts
Member
Posted 22 August 2009 - 04:10 PM
Was not able to get words onto last post. Spx should go up to the 1200 area before more trouble.
Why Russ... I'm seeing some topping indicators. 92% of S&P stocks are above their 50-day MA... We are seeing CVI at 75.... We are also seeing 10-day CPCE 10-day below .60. I'm not saying your wrong here, but it does not look like we break higher on Monday, because of too much headwind... With that said we should drop back lower from here at least in the short term, to negative some overbought tendencies.....
Looking at BDI it also supports at least a lateral move for awhile before we break higher....... If BDI continues on it's downward path it should put more pressure to the downside....
What's the points in your TA with backup that support 1200 before trouble. Barry
Look at the waterfall decline from last autumn, the market fell straight down with small volume, that area is untested and the market can easily just slide right up there before hitting resistance around that 1200 area which is where the downtrendline from 2007 is. As well, my oscillator is pointing at Oct for the final high which is in agreement with Terry Laundry's T theory. Then look for another big low next March/April. from my blog... http://1.bp.blogspot...re Aug 2009.gif
Vix is also pointing at an Oct high with its big diagonal triangle, triangle theory suggests the final break-out of the formation around the 80% area which takes it into Oct. http://1.bp.blogspot... oct 09 low.gif
Russ:
Thanks for the explanation. Since I have a day job, I don't always check all different options.... I do have breakdown of VXO to note the change in the downtrend when it happens. I see now we can head higher into October... However the ST and IT indicators are overbought, but advance/declines are still relatively strong so that is one for the bull case.... Thanks for the detailed explanation......
Barry


