many are still expecting a re-test.
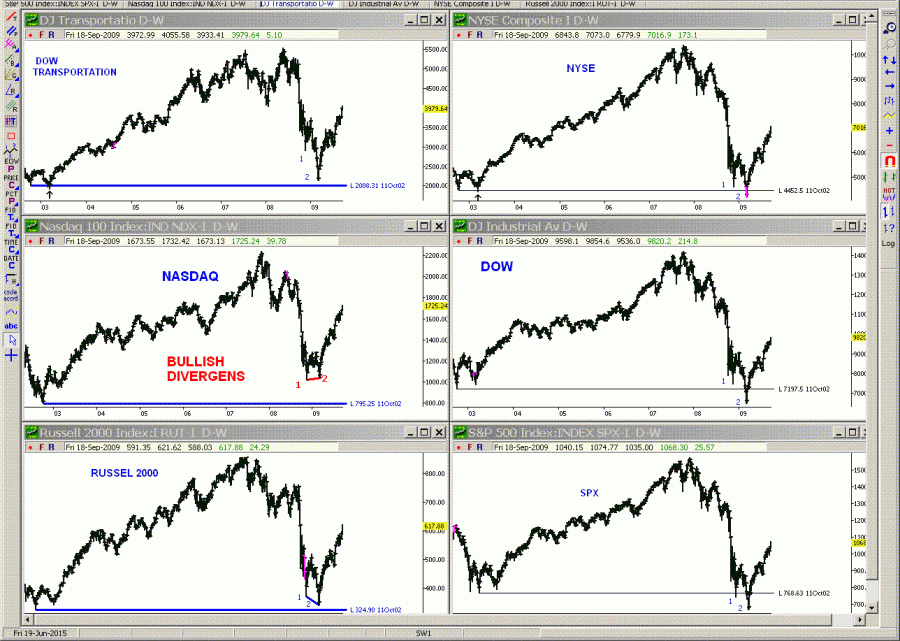
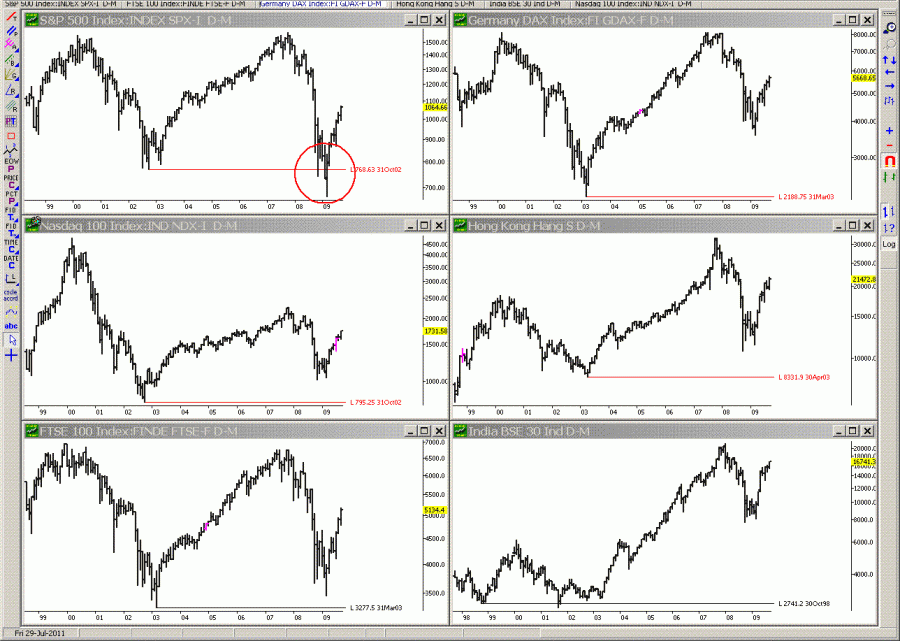
What they igore, is the fact that almost all other indexes , worldwide did not break.
Below are some US indexes, and note that NDX did not only close above the 2002 low but also produced a bullish non- confirmation to the Nov2008 low (Nasdaq Composite did not - so we also had a bullish non confirmation between NDX and CompQ!)

In these charts we have som other internatioal non-confirmations.
So how come everybody focus on SPX and DOW?
Beats me!
The way I see it - we did not hav a breakdown - we had a test of th 2002 low - in a very large perspective.

And talking about non-confirmations. Lets compare Dow Industrials with Dow Transportation - that's a classic, right?
Why don't people talk about that non-confirmation?
Especially since we had the same bullish non-confirmation in 1974.
It has happend before.
After the 1932-1966 bullmarket .
Could there be a link between that bullmarket and the one that ended in 20?? - ?
Read on..............

In this chart - SPX monthly - I have market the end of the bullmarket from 1932 and 1974 with T1 and T2 where T2 is higher than T1.
Let's see what happend around these tops.
1. Connect B1 with B2 at the top - make a parallel line and connect it to B1 in 1970. It catches the 1974 bottom almost exactly.
2. Distance between red B1/B2 is 150% of blue B1/B2 - one and ahalf cycle.
3. Check ou the long term DT oscillator. The 1970-1974 pattern is similar to the 2002-2009 pattern - they were both preceedet by oscillators that did not reach oversold for many ears before the drop.
4.Lets presume we will reach overbought contitions (using DT oscillator) - it will take another year + . That is 2010/2011
5. And we will NOT test the (march) bottom before that.
6. We are presently closing in on a test of the 50% retracement level from the 2007 top - check out 1974 - then we passed the 50% level and did not correct until we are somewhat above it.
Transfer that to the 2009 situation and if a similar development will take place we are in the 1200 area where you find the July 2008 botton (the last one before the acceleration to the bottom) and the june 2006 bottom + a cluster of several fib resistance levels. That's where I belive we will have our first pullback not earlier

But it doesn't stop the.
In my reasearch I have found that the stockmarket is governed by energy points and when you find these energy points it's possible to some degree to conclude were we have turningpoints in price in the future. But most of all, I also think you can establish if the energy point has a long term implications, depending on where they are and which other points they connect to.
In that conncetion, this chart is rather interesting.
If we connect March 2009 low with the end of the bullmarket, using the DOW index (which I consider the end in the DOW index), we find that we have a perfect "Fibonacci spiral" with the 1987 top exactly in the middle. Hence we have establishe three long term energy points, which we can use for tlong term time/price studies in the future.
The market has a tendency to repeat - but not in the expected way - rather it turns things upside down.
So - the way I read it , is that this spiral STARTS at the END of the 1932-1966 bullmarket and ENDS at the START of the next bullmarket!

And really - if you look at this chart and don't know what it is and don't know the time frame - what is it??
It's a long term bullmarket with a flagg formation flying half mast!!
Right?
That's easy!
But when we know that it is a monthly chart of the transportation index from 1948 we are getting fundamental thoughts and hang ups.
What we have to remember, though, is that pattern recognition works in ALL time frames.
And check out the decline into the flagg - it's steep and scary just like any other correction!
And the upmove works the same way - it's the result of a giganomic failure break of the 2002 bottom by dow and SPX (as descibed at the beginning)
It fit's the picture perfect - if it wasn't for all the fundamental (mis?) information.

In that context this chart is rather interesting as well. Check out the long term fib years between the importand tops/bottoms. It does not indicate another turn of importance soon. Nor does the histogram at the bottom which is a DT speciallity.
I have made a 20% swingchart and the software uses the last 8 swings and fibonacci ratios of these swings - ads them up at make a poijection from a selected point.
My selected point was the October high.
The higher the bars the higher is the probabillity for a trendchange and as you can see the highest bars are at the oct/nov 2008 low - and then we have the March 2009 low.
And then ------ nothing.......
No more important turningpoints!
From a fibonacci stand point it could mean that we now will be trending up for a long time.

And why not - here we see how NDX weekly has broken several important resitans levels - not much resistance left...

Wedges in bullmarkets follow bullmarket rules and break on the upside - unless they are a topping formation.
evidently this is not.
A perfect bullish wedge usually breaks close to the apex and a perfect bullish wedge can also have a pre- break preceding the "real " break.
If they do - we can expect a dramatic move from the real break - and we cannot always count on a test of the break - sometimes price moves on.. and on... and on...

Are we ready for the pullback "everybody" is counting on?
Judging from the seasonal chart, compiled by "unfair advantage" using data from 1928 we are not.
Note how we started trading opposite the seasonal index from the beginning of July.
It is now just a couple of days before the first bottom, so there is actually no momentum left for a pullback of any importance.
Instead, just like the stock market - look ahead!
What is the index telling us?
That's right - to the mooooon.


