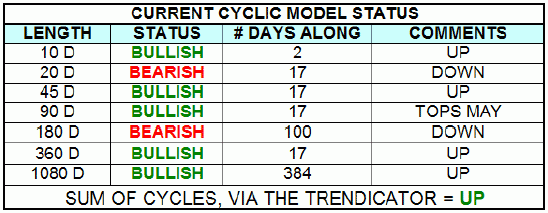
S&P 500 CASH
SPX CASH: Daily Projected Support and Resistance levels: High - 1140; Low - 1132
JUNE SP: Daily Projected Support and Resistance levels: High - 1138; Low - 1130
SPX CASH: 5-Day Projected Support and Resistance levels: High - 1141; Low - 1114
JUNE SP: 5-Day Projected Support and Resistance levels: High - 1139; Low - 1112
SPX CASH: Monthly Projected Support and Resistance levels: High - 1183; Low - 1107
SPX CASH: Yearly Projected Support and Resistance levels: High - 1274; Low - 950
Current SPX Index Postures:
Mid-term (6-8 weeks) = 100% BULLISH from 3/30/03 close (1127.00)
Short-term (1 day - 3 weeks) = BULLISH from 1133.67 (intraday today)
From previous outlook: “On our 60 minute chart you can see that in Friday’s session we took out the minor red VTL line higher, which should mean some minor low is in place on this index. If correct, then the same chart is forecasting the next minor top to occur near April 28, 2004 - plus or minus 2 trading days. Note that this almost perfectly in line with the next Bradley major turn date. With Friday’s momentum trendline break I am labeling the 10 day cycle as 1 trading day along and as bullish, even though from our daily chart we cannot actually really confirm the cycle low in place until our 10-day oscillator turns up. For now the VTL break and the higher low on Friday are enough for me to think this cycle has bottomed and is headed higher for the time being. Obviously, if we were to take out Thursday’s session low of 1120.75 then my labeling will prove incorrect - but only if the 60 minute detrended SPX were to make lower lows at the same time. Right now the 60 minute chart is projecting a rally into the next minor top, which is projected to be near April 27-29, 2004.”
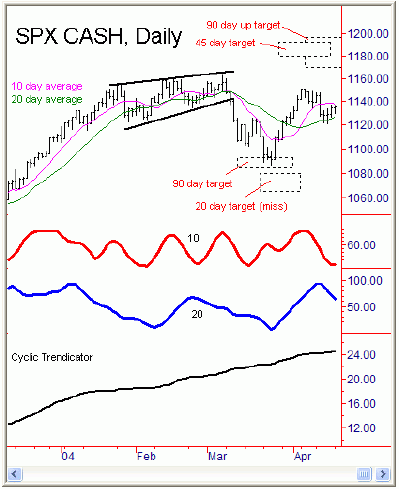
Current analysis: The SPX dropped for an early day low and test of support, holding above the recent 1120.75 swing bottom. From there prices firmed up into late day, and - from the intraday site - one of the minor cycles confirmed an upside projection to 1139.60 SPX CASH, which is good through the closing of trading Tuesday only.
The big problem with today’s action - and certainly one that I do not like - is that today’s upside move came on very low volume (1.2 billion shares), about a 25% decrease from the volume that was seen in Friday’s session. Low volume moves we know are often ‘ripe’ for a reversal, though they can continue for a session - or even several - before they play out in a reversal. Perhaps for now the only thing we can say is that odds will favor a run to higher highs in Tuesday’s session and some test of the 1139.60 area or higher.
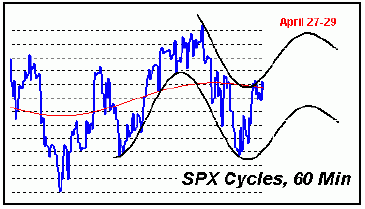
Otherwise, we know our 60 minute cycle channel below - which uses a slightly detrended version of price - is projecting a momentum peak between April 27-29, 2004. From the statistical notes with the 10 day cycle up phases we know that a 2.6% rally has been seen in most of the upward moves, which will normally last from 3-7 trading days from trough to peak. If we act under the assumption that a 10 day cycle low is in place at the 1120.75 swing bottom, then a 2.6% rally or greater will target at least a re-test of the 1150.57 swing top from 4/5/04. Remember as well, that almost all of the second 10 day up cycles that have been contained within a larger 20 day cycle have usually gone on to make new swing highs above the prior 10 day top (1150.57 SPX). This would also suggest that new swing highs should be seen in the coming days/weeks going into the cycle top that should be coming between April 27-29th.
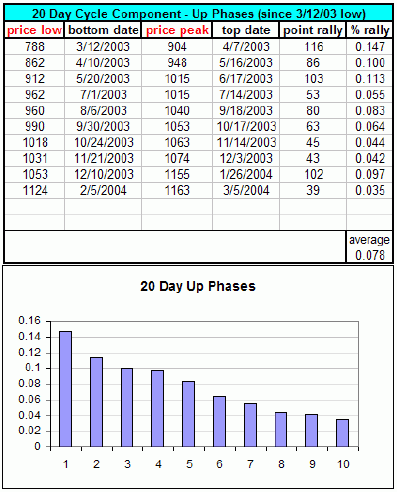
I can tell you right now that the only problem that I see with the above is, again, today’s low volume action. This could call into a second possibility, one that I give about 40% odds of occurring - and one that I feel I should go over in tonight’s outlook. That scenario would be with the 20 day cycle, which we know is 17 trading days along, and has been bottoming recently in the 18-24 day range. The second scenario would see a test of the low 1140 range in the next day or so, and then that rally is quickly retraced and is followed by new swing lows (below 1120.75 SPX CASH) on a quick selloff that does not make new lows with our 60 minute detrended SPX; this is then quickly retraced and is followed by the rally into the expected top that is due near late-month. This alternate path would bottom the market with the 20 day cycle, and the end result would not change - in other words it would be followed by a rally to or above the 1150.57 swing top, as most 20 day cycle up phases have seen. Why? Because 8 out of 10 of the 20 day cycle up phases (80%) with the SPX have seen rallies of 4.4% or greater from trough to peak, as shown on the table above left. And, a 4.4% rally from a slightly lower low than 1120.75 - whether it is 1115, or all the way down to the 1107 monthly projected support low - would still end up targeting a move to or above the 1150.57 swing top in the coming days/weeks, with the ideal timeframe for the next top again near April 27-29, 2004.
Having went over all of the above, we know that odds will still favor a move into the 1168-1176 region or higher will be seen before the larger cycles peak in May. Whether this tag will come as the 20 day cycle next turns up is guesswork for now. Either way, for our mid-term trade we will likely want to take at least some profits on our current position if the 1160’s are tested later this month, if hit, as this April 27-29 date range also encompasses the upcoming Bradley cycle turn. How much of our position we will want to exit will depend entirely on volume and price considerations at that time - if indeed the analysis does play itself out as expected. Stay tuned.
NASDAQ 100 CASH
Daily Projected Support and Resistance levels: High, 1486 - Low, 1461
5-Day Projected Support and Resistance levels: High, 1475 - Low, 1413
Monthly Projected Support and Resistance levels: High, 1529 - Low, 1403v Current NDX Index Postures:
Mid-Term (6-8 weeks) = BULLISH for a 100% position from 1440 (3/30/04)
Short-term (1 day - 3 weeks) = BULLISH from 1476 (4/14/04)
From Wednesday night‘s outlook: “The one mild positive for the short-term here is that volume once again contracted as the index made new swing lows, contracting to the tune of about 5.9% as compared to Thursday’s overall volume numbers. Chart at left we need to see a turn up in the red 10 day oscillator in order to confirm that a 10 day low is in fact in place here and is headed higher in what should be a 4.3% or better rally off the lows. I am tempted to add to our mid-term trade here, but instead would rather see a more solid contraction in volume (with price moving lower) and/or prices retreating to below our original 1440 entry in the coming days. Odds still favor a test of the 1526 area or better is coming on or before our larger cycle peak that is set for late May, so the buy side has to be favored here.”
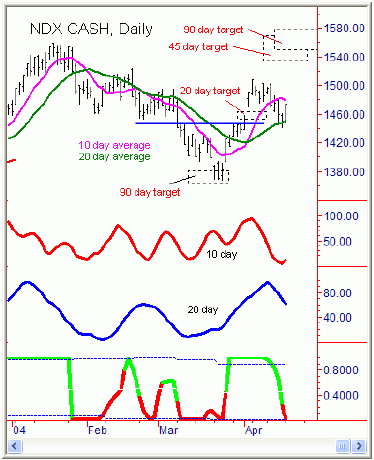
Current analysis: The NDX saw a rally day, holding above Friday’s 1440 swing low - and taking out Friday’s 1460 swing top as well. Friday’s light volume move to new lows was the initial up-impetus; the only problem is that today’s rally also came on lower volume (about 1.7 billions shares), which questions it’s staying power. Having said that, our 10 day cycle oscillator turned up at today’s close, which has to be viewed bullishly in the coming sessions as long at the recent swing low holds.
Otherwise, we know from our statistical studies that 80% of the 10 day cycle up phases have seen rallies of 4.3% or greater on the NDX. Taking the 1440 swing low this would target a test of 1501 or higher in the next week or so before this cycle tops out, with at least the potential for higher numbers to be seen. For now we should see at least some follow through higher in Tuesday’s trading session.
Jim Curry
Market Turns Advisory
Email: jcurry@cycle-wave.com


