Jump to content


Photo

Big Mac Attack


  • This topic is locked This topic is locked
173 replies to this topic

#21 diogenes227

diogenes227

    Member

  • TT Patron+
  • 5,120 posts

Posted 22 January 2010 - 12:35 AM

Turns out the cautionary tale ruled the day.

Had a NYSI sell yesterday and follow-through today. Not exactly a surprise. The NYSI rally, as noted above, was long in the tooth. And as noted by the NYMO trendlines on the chart above and the red circles on the chart below, the NYMO highs below highs were, as usual, foretelling today's drop and the likelihood of more to come (although, of course, there can be bounces).

If one's a bull, one wants to see first a low above a low on the NYMO (like on 11/2/09) followed soon thereafter by an up turn in the NYSI (like on 11/09/09) to get the next ten-or-so-week rally going. Simply put, we ain't there yet.

In the meantime, if one's a bear, play the short side, sell strength, enjoy the slide.

:)

http://stockcharts.c...5571&r=1205.png

"If you've heard this story before, don't stop me because I'd like to hear it again," Groucho Marx (on market history?).

“I've learned in options trading simple is best and the obvious is often the most elusive to recognize.”


"The god of trading rewards persistence, experience and discipline, and absolutely nothing else."


#22 diogenes227

diogenes227

    Member

  • TT Patron+
  • 5,120 posts

Posted 28 January 2010 - 03:21 AM

"If one's a bull, one wants to see first a low above a low on the NYMO (like on 11/2/09) followed soon thereafter by an up turn in the NYSI (like on 11/09/09) to get the next ten-or-so-week rally going. Simply put, we ain't there yet." Well, we got half way there Wednesday with a small low above a low on the NYMO (it looks a bit tenuous to me but it is what it is); price reversed with volume; the RVX has been declining all along; and TNA is peeking out of oversold on the CCI. In other words, there could be, at least, a bounce here. NYSI remains on a sell.

"If you've heard this story before, don't stop me because I'd like to hear it again," Groucho Marx (on market history?).

“I've learned in options trading simple is best and the obvious is often the most elusive to recognize.”


"The god of trading rewards persistence, experience and discipline, and absolutely nothing else."


#23 diogenes227

diogenes227

    Member

  • TT Patron+
  • 5,120 posts

Posted 29 January 2010 - 04:34 PM

Obviously, the attempt to bounce suggested by the little wiggle in the NYMO has been wiped out by the last two days' price action. Interestingly, that doesn't that happen that often in a bull run, and may make one wonder about the nature of the market going forward.

So, for the bears, the NYSI sell prevails and continues...

For the bulls it's back to square one -- wait for a low above a low on NYMO (it you're aggressive), followed by an upturn in NYSI...

Given the ominous quality of the following chart the bull case may take a while (kudos to SemiBizz who first posted a simple price/volume chart like this back in November, 2007, and basically called the end of the 2003 bull market (the blue circle)).

Have a good weekend. :)

http://stockcharts.com/c-sc/sc?s=$COMPQ&p=M&yr=3&mn=0&dy=0&i=p95026571947&a=163053778&r=6430.png

"If you've heard this story before, don't stop me because I'd like to hear it again," Groucho Marx (on market history?).

“I've learned in options trading simple is best and the obvious is often the most elusive to recognize.”


"The god of trading rewards persistence, experience and discipline, and absolutely nothing else."


#24 diogenes227

diogenes227

    Member

  • TT Patron+
  • 5,120 posts

Posted 05 February 2010 - 12:12 AM

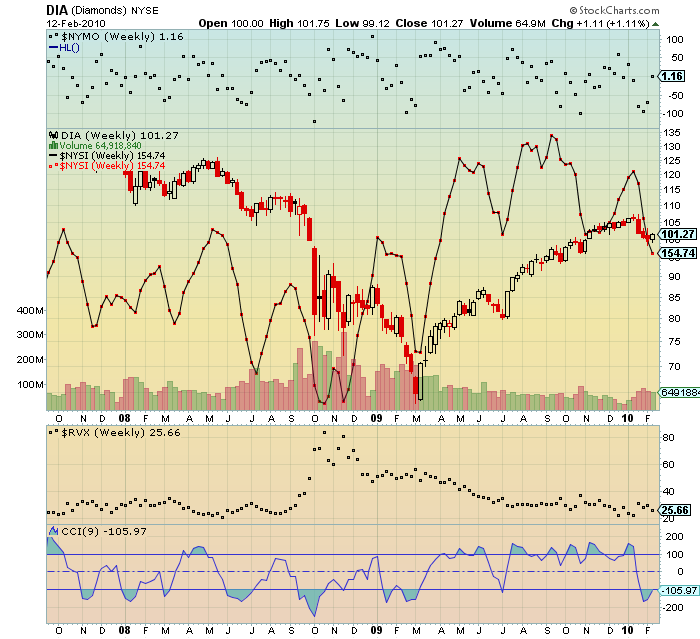
Just posted this on a Fearless Forecasters thread about how splendidly simple the NYSI signals are, especially the current Sell signal which is taking no prisoners. Posting it here for the record of this thread,

I like the basic signal. And certainly this one has worked out well. The problem is that there are generally alot of whipsaws prior to one of these extended moves in the NYSI. And these whipsaws can add up to a significant total loss, especially if your style is to trade the leveraged ETFs. Have you done any backtesting based on actual trades in the ETFs? Could you post the results if you have?

IT


I have back tested it, and I trade those leveraged ETFs.

You are right, the whipsaws make it inconsistent and sometimes pricey. In addition the NYSI lags the turns. Return are dependent on what you trade in conjunction with the NYSI. Remarkably the leveraged ETFs are more likely to make money than non leveraged ETFs, mainly because you want the trading vehicles to out perform on the winning signals while being stopped out quickly on the losing trades. Oftentimes, stock selection using the market signal as an entry is quite profitable.

However, none of that much matters.

I have written extensively on Swing Waves about the NYSI and NASI as the context for trading -- when the NYSI is rising play the long side, when it falling, play the short side. Context is all the matters -- that and persistence, discipline and experience, which is all that the ******* of trading actually rewards. I would suggest taking the trade in the direction of the NYSI and playing defense (using stops) the second the trade is on. For example there was NYSI sell on the 15th that was stopped out for a loss on the 19th (actually with the weekend and holiday that was one day later). Then this current move began...needless to say, that loss is a blip in history (as I said in the header, when you are on the right side of the market context sometimes you just get lucky).

There are many traders here on Fearless Forecasters who's goal appears to be catching the exact bottom or the exact top. I am always amazed at how many try to short a rising NYSI and now are trying to go long a falling NYSI, and then express their frustration over how the market is treating them, but to each his own trading style. But, back test or no back test, my experience is that there is plenty of time to trade and plenty of profitable opportunities when the NYSI's direction is known.

Linda Raschke, who every trader ought to read repeatedly, once said: "I don't want the top. I don't want the bottom. I want the big fat safe thing in the middle." Given that came from the same woman who also once said "never take a loser to bed", I've often wondered if she was actually talking about a trade or not.

Good trading to you.

"If you've heard this story before, don't stop me because I'd like to hear it again," Groucho Marx (on market history?).

“I've learned in options trading simple is best and the obvious is often the most elusive to recognize.”


"The god of trading rewards persistence, experience and discipline, and absolutely nothing else."


#25 diogenes227

diogenes227

    Member

  • TT Patron+
  • 5,120 posts

Posted 09 February 2010 - 05:51 PM

Got a low above a low divergence on the NYMO with TNA (and most other index ETFs). And the Russell Vix (RVX) turned down, and CCI on TNA clicked up out of overbought...

This is an aggressive trader's buy in a bull market, at least for a swing and maybe more.

That doji (see chart below) is worrisome, and the NYSI remains on a sell so this rally attempt can still go south in a hurry.

But given that, on the current Jan 20 NYSI sell signal, TZA is up nearly 22 percent, BGZ is up 18 percent, TYP is up 21 percent, TWM is up 14 percent, SDS is up nearly 12 percent, QID is up 12 percent and the SPX is down 67 points, one might want to take some profits or at least tighten short-side stops.

Good trading to everyone. :)

http://stockcharts.c...1656&r=1129.png

"If you've heard this story before, don't stop me because I'd like to hear it again," Groucho Marx (on market history?).

“I've learned in options trading simple is best and the obvious is often the most elusive to recognize.”


"The god of trading rewards persistence, experience and discipline, and absolutely nothing else."


#26 jack

jack

    Member

  • Traders-Talk User
  • 907 posts

Posted 09 February 2010 - 11:56 PM

thx for the thread if you, charles, and porche were the only ones left, I'd check in (almost) daily :)

#27 diogenes227

diogenes227

    Member

  • TT Patron+
  • 5,120 posts

Posted 12 February 2010 - 07:48 PM

jack, thanks for the compliment. Just trying to keep my own head on straight here. If it helps you even better.

Got a NYSI buy signal today by the skin of its NYSI teeth. Up one point. One point. Oh well, computers can't the difference between a dime and a dollar. Still, this is only context for trading, in this case the long side until proven otherwise. I wouldn't be surprised to see a dip back below the zero line on NYMO after the market's run from Tuesday (when the NYMO low above a low went in for aggressive traders, as noted above) to Friday, but the benefit of the doubt going forward is still to the long side.

For the record, TZA closed out today up 12.3 percent, BGZ up 14.8 percent, TYP up 16.4 percent, TWM up 7.9 percent, SDS up 10 percent, and QID up 8.7 percent on the JAN 20 NYSI sell signal.

I just posted this on a thread on the FF board:

FF markets confused, volatility post

I'll copy my remarks here too since they are relevant to this thread also and indicate some of what can be done in the context of the great McClellan Oscillator.

What's going on here? The NYMO put in a low above a low divergence this week, and from that moment on this was a great week! Half my TNA scalped four percent in a couple of days, and the other half is sitting on a nearly nine percent profit.

Markets are never confused only people are. Maybe it's the S&P that's the culprit. I quit trading that index years ago (no, decades ago) when I finally realized all that stuff that's tied to it mucks it up -- futures, options, options on futures!, arbitrage everywhere, bellwether games (i.e., every Harvard MBA claiming to outperform it, especially while losing tons of other peoples' money in a down trend). I admire the traders here who are able to chip a few cents off that monstrosity but as for me it was like stuffing ten pounds of marshmallows into a one-pound bag -- the profits kept squishing out here and slipping away there.

Volatility is always a trader's friend. Movement, movement, movement that's where the money is.

When you get frustrated enough by the S&P, you might look around a bit. There's a lot simpler ways to skin this market cat without trying to match wits with the JP Morgans and their supercomputers. Try the Russell-- the Russell 600 call doubled this week. Or gold -- the GDX rose nearly 8 percent from Monday's close. Or energy -- ERX rallied 9 percent his week. Anybody take a look at BIDU calls since the NYMO low above a low on Tuesday? Holy cow, what a great, great week!

Have a fun weekend and holiday, guys. Plenty of time for homework.
:)

Edited by diogenes227, 12 February 2010 - 07:50 PM.

"If you've heard this story before, don't stop me because I'd like to hear it again," Groucho Marx (on market history?).

“I've learned in options trading simple is best and the obvious is often the most elusive to recognize.”


"The god of trading rewards persistence, experience and discipline, and absolutely nothing else."


#28 CLK

CLK

    Member

  • Traders-Talk User
  • 10,787 posts

Posted 14 February 2010 - 08:32 AM

Diogenes227, The weekly NYMO had a big jump, but no weekly turn in NYSI. That is different than past bottoms. More like July 08 or last week of Jan. 09. Could turn next week, but that is a big divergence when the weekly NYSI fails to follow. I think the 4 down 1 up pattern is complete. nysi_2.png

#29 diogenes227

diogenes227

    Member

  • TT Patron+
  • 5,120 posts

Posted 15 February 2010 - 03:19 PM

CLK, I don't pay attention to the weekly because that is not my time frame (the daily is) but looking at your chart it look likes you might have be right and that could be a read of underlying weakness. Thanks for pointing this out. As noted in my last post above I'm not entirely happy with the daily NYMO's one-point peek above the zero line I will not be surprised to see the market and the NYMO, and thus the daily NYSI, take another jolt to the down side. In fact, I half expect it. A move like that often happens in the third or fourth week of a McClellan cycle and, if you'll take a look at the chart posted about yours you'll see we will be entering the third week on the NYMO this week. Usually that is called "the buy spike" on the McClellan Oscillator and I believe until proven otherwise it will again be a "buy" spike. If it starts to happen, I will stop out my current longs and look to buy back as soon as the spike completes itself. Good trading to you. :)

"If you've heard this story before, don't stop me because I'd like to hear it again," Groucho Marx (on market history?).

“I've learned in options trading simple is best and the obvious is often the most elusive to recognize.”


"The god of trading rewards persistence, experience and discipline, and absolutely nothing else."


#30 mfrazier

mfrazier

    Member

  • Traders-Talk User
  • 4 posts

Posted 16 February 2010 - 06:19 AM

Out of lurking for a minute to add the following comment made quite a while back by Mortiz. Judging by the identical NYSI values shown on both the daily (diogenes's) and weekly (CLK's) charts, comment is still valid three years later... "The StockCharts weekly McSum data is simply the daily Friday McSum values plotted, and looks nothing like the actual weekly NYSE McSum using the Barrons weekly breadth data which calculates weekly advances and declines by comparing each component's Friday over Friday price change, here is what the "real" weekly AD McSum currently looks like...." Mortiz, Aug 10, 2007 Doesn't mean the weekly SI has turned up, just that Stockcharts still seems to be calculating it wrong. MF