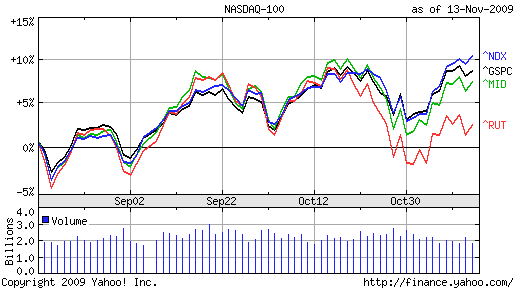
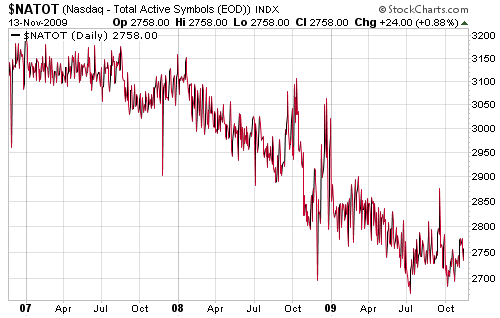
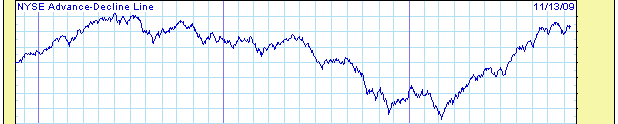
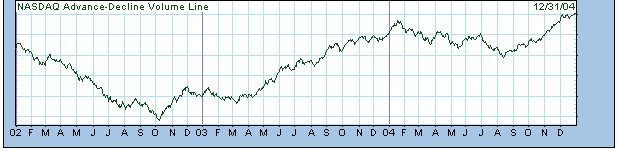
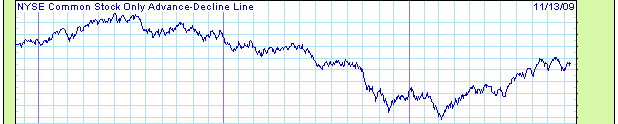
Below is a recap of the various A/D lines through Friday, showing that they failed to confirm the widely publicized big cap averages.
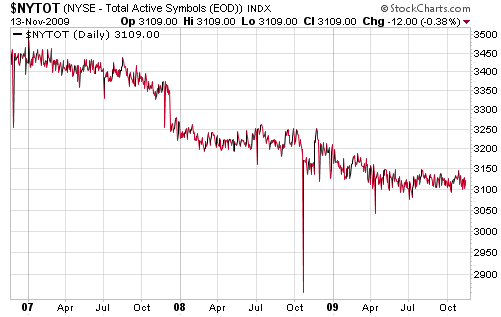
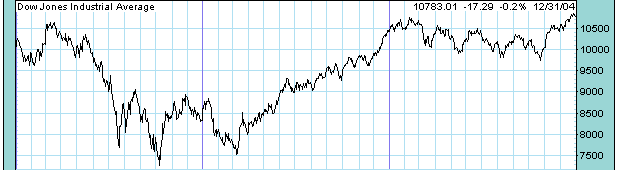
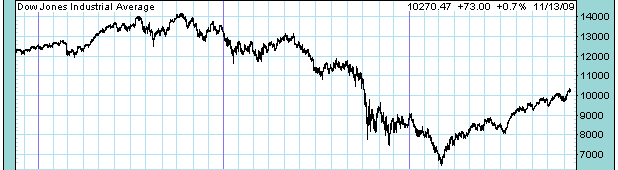
The top chart is the Dow Jones Industrial Average for reference, then NYSE composite, followed by the charts for the advance-decline lines for the New York Stock Exchange, the "total market", the S & P small cap index, and the Nasdaq for comparison. Note, importantly, their unanimous failure to confirm recent highs in the DJIA and SPX as those big cap averages made new highs. The charts are through Friday November 13, 2009, so you need to look at the latest data on the far right side of each chart in the top section.
If you look at the part of 2003 that was comparable to the current market situation, you'll see that as the DJIA and SPX made new high in late 2003, NYSE index and the A/D line for each sector confirmed. The current failure is potentially a hugely significant event, imo, and when it occurred finally in 2004, we were at the very top of the run and starting a correction that lasted more than half a year. Another important flag - and perhaps the correction is already underway.
DJIA

failure
failure
failure
failure
failure
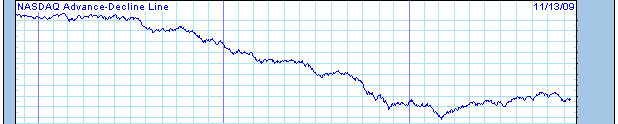
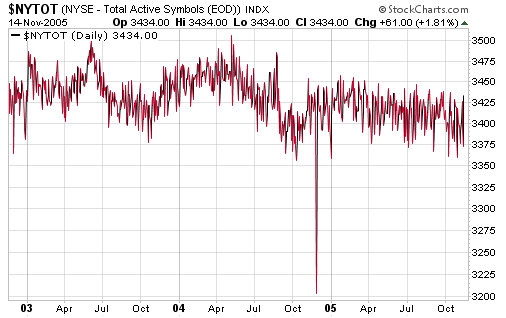
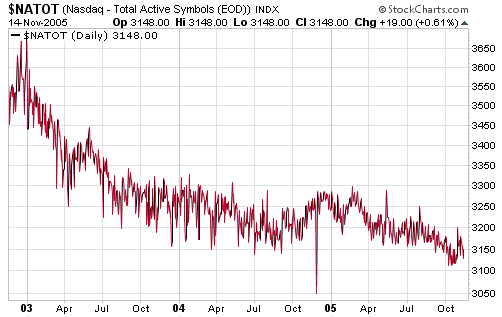
Notice, importantly, that the NYSE and these A/D lines NEVER failed to confirm on ANY rally peak in 2003 after the March 2003 low- and that when this failure finally showed up in March 2004, we were then in the early stages of a correction that lasted August 2004.
NewHighs
Confirmed
Confirmed
Confirmed
Confirmed
Confirmed
Edited by IYB, 14 November 2009 - 09:15 PM.

 failure
failure
failure  failure
failure
failure
failure
failure  Notice, importantly, that the NYSE and these A/D lines NEVER failed to confirm on ANY rally peak in 2003 after the March 2003 low- and that when this failure finally showed up in March 2004, we were then in the early stages of a correction that lasted August 2004.
NewHighs
Notice, importantly, that the NYSE and these A/D lines NEVER failed to confirm on ANY rally peak in 2003 after the March 2003 low- and that when this failure finally showed up in March 2004, we were then in the early stages of a correction that lasted August 2004.
NewHighs  Confirmed
Confirmed
Confirmed
Confirmed
Confirmed
Confirmed
Confirmed
Confirmed
Confirmed

 SS
SS
 Regards, D