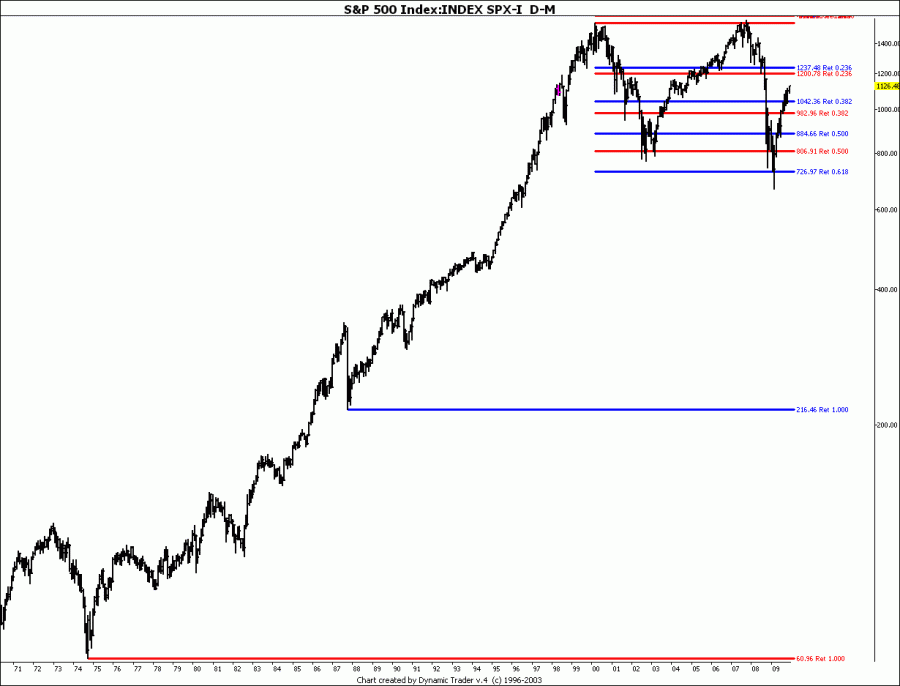
What you didn't see, understand or perhaps ignored Part II
#11

Posted 26 December 2009 - 02:40 PM
#12

Posted 26 December 2009 - 03:06 PM
Stig,
Excellent work. The powerful move up in the NYAD supports your analysis.
Semi,
2000 top was mostly a tech bubble, centered around Y2K, with the subsequent unwinding resulting in a 80% haircut in the nasdaq, much less elsewhere.
2007-9 decline was all about the collapse of over-leveraging, ignited by the real estate market and spiraling into the BSC, Lehman's, etc of the world. Not surprising to see tech not hit as hard this go around.
Doesn't really translate into who to focus on, IMHO.
Doc
Are you citing fundamentals ?
I can't go there.
Technical Analysis has to stand on it's own merits. If you dismiss events as "outliers" your charts aren't worth the paper or pixels on which they are printed...
Richard Wyckoff - "Whenever you find hope or fear warping judgment, close out your position"
Volume is the only vote that matters... the ultimate sentiment poll.
http://twitter.com/VolumeDynamics http://parler.com/Volumedynamics
#13

Posted 26 December 2009 - 03:54 PM
#14

Posted 26 December 2009 - 05:15 PM
Am I so unclear?
I don't doubt any of your conclusions about SPX, but since SPX doesn't lead markets any more by your own statements, why use it in long term forecasting as your PRIMARY INSTRUMENT?
Nowhere do I indicate that SPX is the leader. On the contrary - what I wanted to say, is that people are looking the other way when it comes to watching what's happening.
The way I see it, most people are quoting SPX when they discuss the market, when all the clues are in other indexes or in different spreads.
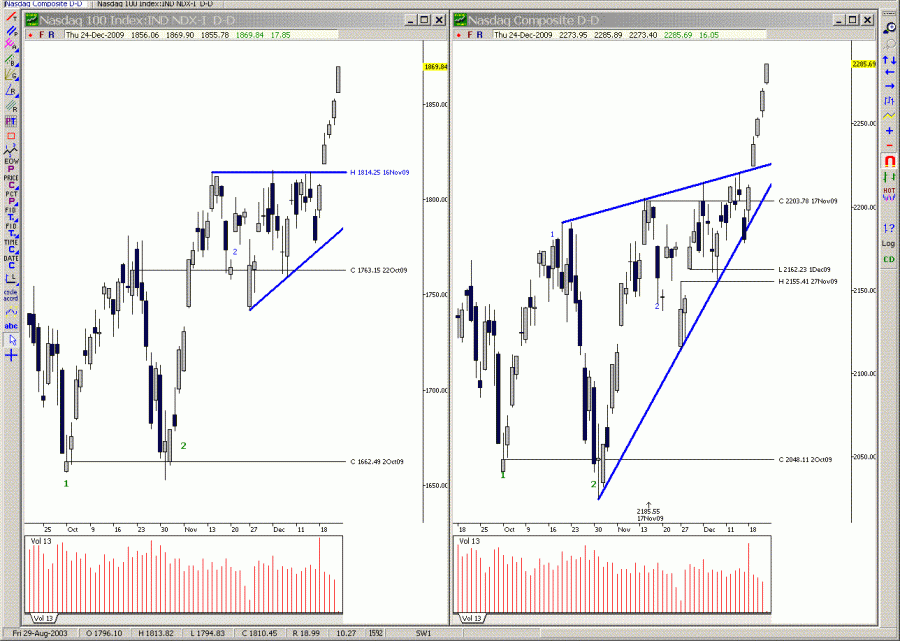
I do not focus on NDX. It's just another example of an index that has broken out - like DOW Utillities for instance at the beginning of December. Nobody noticedit on FF as far as I remember.
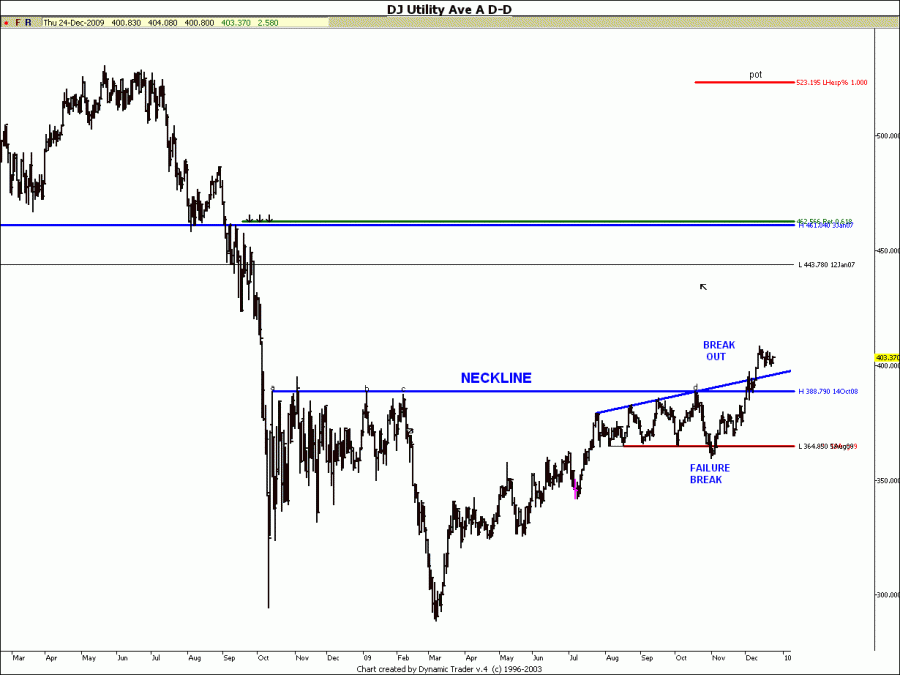
It's the combined picture of Nasdaq, NYSE, DOW Utillities,VIX, the dollar, Indexes i Euro etc etc, that makes the situation so bullish.
All the talk has been on SPX and how important the 1120 has been, while other indexes has broken out all over the place at just as important levels. an nobody takes notice.
THAT was my point of the post.
But still quite unclear that the Nasdaq will power us to new highs using Nasdaq 5200 as THE APEX.
I am not implying that Nasdaq will power us to anything. I am implying that Nasdaq is the first one to reach something or to break out or break down. Like you said, it's only 100 stocks...
Spokyone:
I also find your choice of pattern and trendlines intersesting, but not how I would draw or consider them
It took me many years to come to terms that lines can be drawn differently and that the different patterns we find that way are equally true. They, each in it's own way describes what the different groups that participate in the developent of the pricecurve are doing. None of the patterns are "wrong". The live their own lives and one of them will turn out to be the "right" one. But befor the game is over you don't know which one, so you have to watch them all. And if you have them all on the chart you can most of the time see in time which one will turn out to be the "winner". If we are using the important pivots we can't draw a pattern that is wrong.
I see no breakout of the rising wedge.
-------------
I have some disagreement with your statement above. Pull up Nasdaq composite 2007 and you see that Nasdog top 2 weeks later than Industrials and SPX. So, is Nasdaq a true market leader when comes to such century pivotal top???
Good point, and I do not have an answer. But a question. Is important? Does it mean that it can't lead before and/or after if it topped out later than industrials?
I don't have the answer....
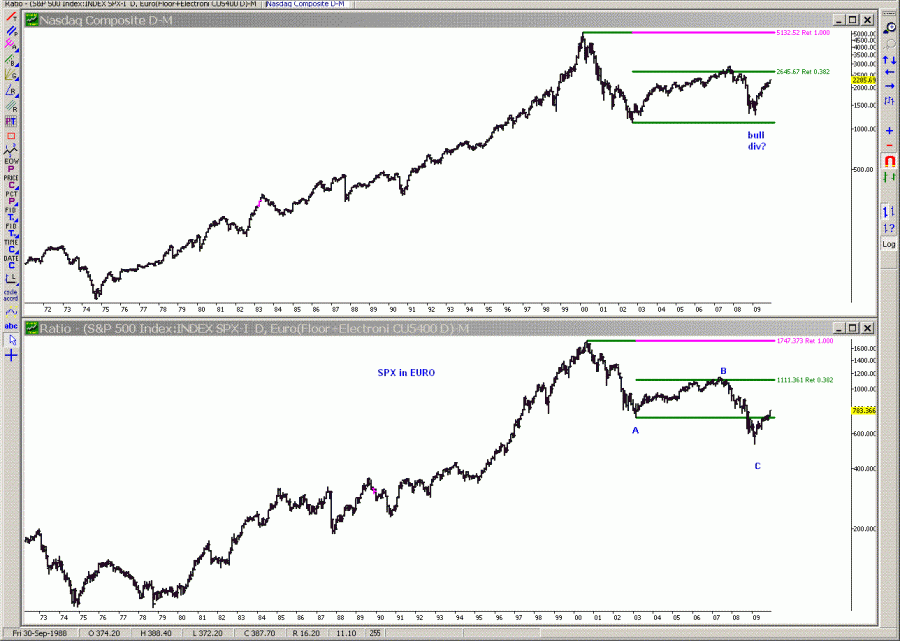
Or if Nasdaq is truely the market leader as it measures appetite for risk, the fact that it still never made it past 2000 top says the great bear market is still alive???
Maybe there never was a great bearnarket. Perhaps it was only a great correction? With Nasdaqs bullish divergence leading the continuation of a great bullmarket?
Perhaps the true charts of US indexes should be drawn i the Euro currencey..........
I am swedish living in denmark
#15

Posted 26 December 2009 - 05:18 PM
#16

Posted 26 December 2009 - 05:26 PM
#17

Posted 26 December 2009 - 05:36 PM
I think the jury is still out on the Euro as a currency. Let's see what happens to it as the rest of the participants deal with looming default problems in Greece, Spain, Ireland...
The way I see it, most people are quoting SPX when they discuss the market, when all the clues are in other indexes or in different spreads.
We agree on this. However if you look at most of the popular T/A analysts, markets are mostly measured by them using the SPX... Seems to be some kind of standard. I see the same mentality displayed in currency analysis... popular analysts use the US Dollar Index - I don't find that one useful at all in my forecasting practice and focus on currency crosses (and not just US$ crosses).
The jury is still out on the currencies, we did see it proven to us this week that the equities don't care any more what the currencies are doing and whether the Euro or US$ goes up or down. We no longer use the currencies as a guide for equity market forecasts, since there seems to be no present correlation.
We have identified a new leader sector for this phase of the rally and that is the $SOX Index...
Richard Wyckoff - "Whenever you find hope or fear warping judgment, close out your position"
Volume is the only vote that matters... the ultimate sentiment poll.
http://twitter.com/VolumeDynamics http://parler.com/Volumedynamics
#18

Posted 26 December 2009 - 06:48 PM

#19

Posted 26 December 2009 - 07:07 PM
I would make the case that the Euro is still an untested instrument, with 10 years too short a history to draw any long term conclusions...
I think the jury is still out on the Euro as a currency. Let's see what happens to it as the rest of the participants deal with looming default problems in Greece, Spain, Ireland...
The way I see it, most people are quoting SPX when they discuss the market, when all the clues are in other indexes or in different spreads.
We agree on this. However if you look at most of the popular T/A analysts, markets are mostly measured by them using the SPX... Seems to be some kind of standard. I see the same mentality displayed in currency analysis... popular analysts use the US Dollar Index - I don't find that one useful at all in my forecasting practice and focus on currency crosses (and not just US$ crosses).
The jury is still out on the currencies, we did see it proven to us this week that the equities don't care any more what the currencies are doing and whether the Euro or US$ goes up or down. We no longer use the currencies as a guide for equity market forecasts, since there seems to be no present correlation.
We have identified a new leader sector for this phase of the rally and that is the $SOX Index...
"Seems to be some kind of standard"
In my world you can't use "standard" when analysing the market. Different things work at different times. But what you say is true, most people use the same aproach for everything and this time is a good example.
"The jury is still out on the currencies, we did see it proven to us this week that the equities don't care any more what the currencies are doing and whether the Euro or US$ goes up or down. "
We did see it proven.....?
I don't agree. What we see is a bull divergence in favor of stocks. They see that the dollar correction is just a correction. When the down trend continious, stocks will acclerate.
"I think the jury is still out on the Euro as a currency. Let's see what happens to it as the rest of the participants deal with looming default problems in Greece, Spain, Ireland... "
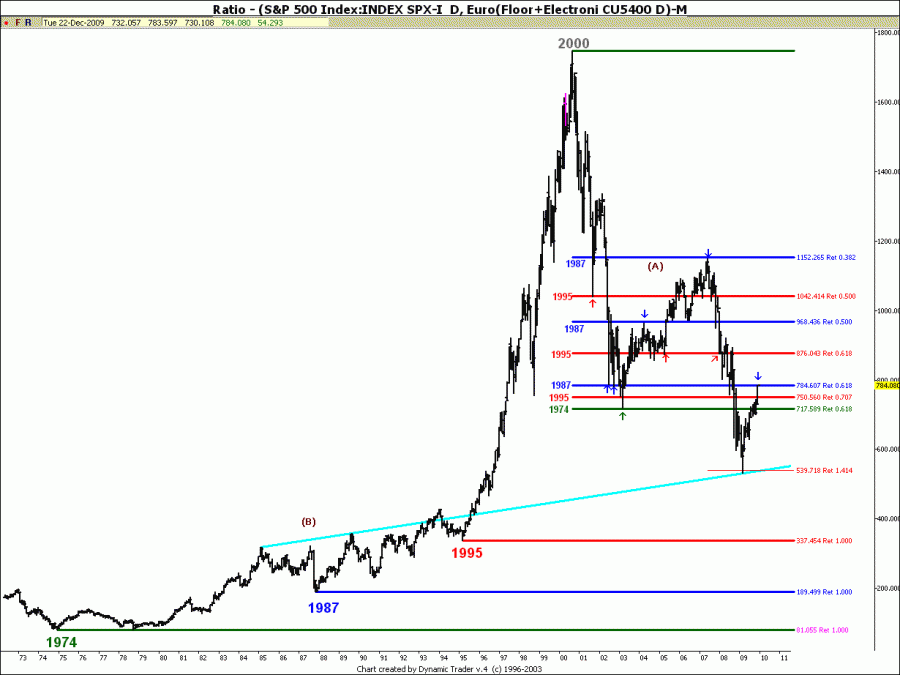
That's not the point. The point is, how has SPX, NDX and DOW behaved technically if you use Euro instead of Dollar for pricing?
In the chart below from 1972, (is that long term enough?) we can see if we use the 3 most important bottoms 1974/1987/1995 and the top 2000, we can see how perfect the most importan fibratios stops the SP500 index at tops and bottoms.
You have here an exactness you don't find in SPX measured in $$.
What I heare from people on the matter seems to be opinions not expeience.
Check ou the chart and prove me wrong
And Arbman.... I hear the log line argument a lot. And what I hear from most, is that they favor one or the other.
I actually favor both - since most often they show the same thing, just in different ways.
However with regard to the ascending broadening wedge I must admitt I did not check log.
HOWEVER - if a pattern shows up in line but not in log - it does NOT mean the line pattern is misleading it IS there. and since it IS there you have to take it into account when you make your analysis. You can't ignore it.
That's my last comment for tonight, it's one am in DK......
#20

Posted 26 December 2009 - 07:31 PM
