Crafting the rhythms series 09/03/2010
September
equinox - Sept 23 03:09 ( UTC date and time )
seasonal senery:
Grand Teton National Park, Wyoming
Brief review:
-------------------------------------------------------------------------------------------------------
Jul 8 2010, 11:44 AM post # 20
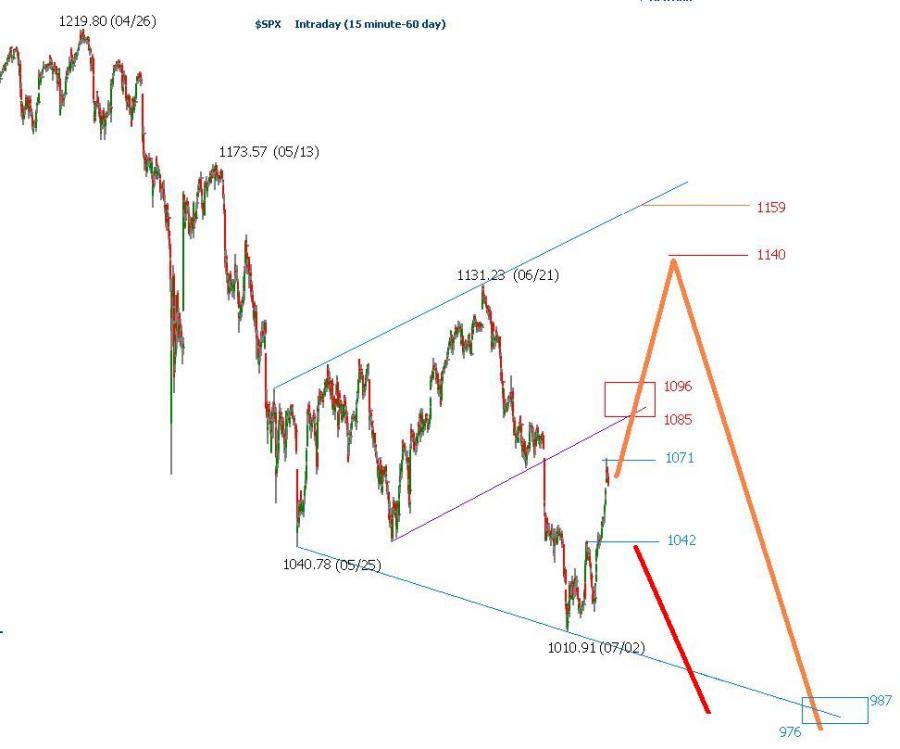
The critical pivots to gauge the direction is 1096 [up] and
1042 [down].
chart
http://traders-talk....14590_thumb.jpg
chart indicated 1140 as the potential high roll over point, 976-987 as the potential low target zone
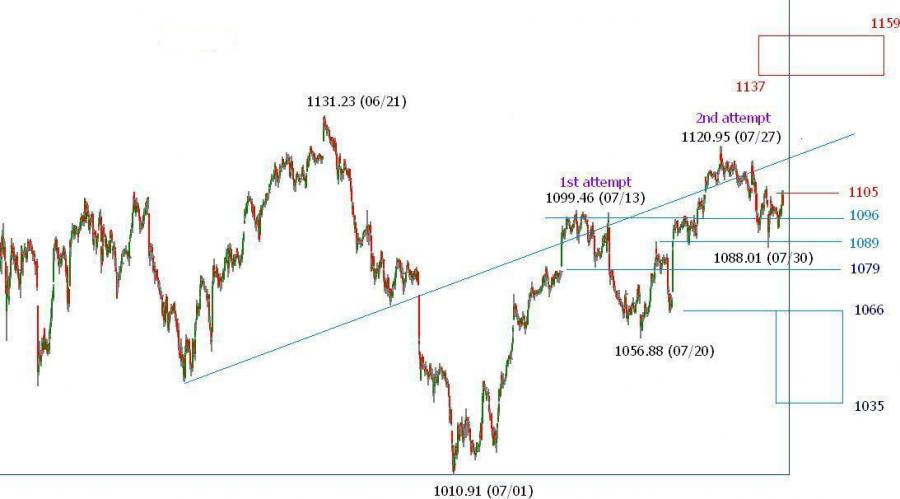
Aug 14 2010, 10:55 PM post # 32
- 1137 is an unrealized target.
- Use the local frame 1010.31-1129.24, resistance is 1094-1104, down pivot 1084, support 1070-1055,
1045-1035.
Aug 17 2010, 09:01 AM post # 33
Dates for a potential secondary Low. 09/1709/3010/26
Polarity is always a puzzle, but, it can be perceived 1-2 weeks before the target date.
-------------------------------------------------------------------------------------------------------
( a ) Index marked an intraday high 1129.24 on 08/09, off target 11 points, Then, reversed down.
( b ) Index visited 1094-1104, 1084, 1070-1055, and 1045-1035; On 8/31, after index made the third attempts on 1040, it reversed back to zone 1094-1104. a quite impressive vertical jump.
( c ) Since index closed higher than the gauges 1084 and 1096, Bull owns the upper hand at this writing.
( d ) Dates for a potential secondary Low. 09/1709/3010/26, in progress.
Updates:
1.
As long as index stays above 1096, it dismisses near term bearish calls.
2. Target dates for a secondary low is in between 09/1710/26. details refer to [1],( a ) & ( b )
3. Target zone 1000-1013, 968 987. The middle term target is 944-948
[ 1 ] Near term
( a ) King Wen's Sequence
[81,126,63,108,90,99,54,117,72] (not in a sequential order)
High
03/06/09 BASE
06/11/09 67TD 0939.04 [63]
10/21/09 91TD 1101.36 [90]
01/19/10 59TD 1150.45 [63]
04/26/10 66TD 1219.80 [63]
08/09/10 73TD 1129.24 [72]
1129.24 Aug 9
1128.75 Aug 4
1127.30 Aug 2
Low
03/06/09 BASE
07/08/09 85TD 0869.32 [81]
11/02/09 82TD 1019.95 [81]
02/05/10 64TD 1044.50 [63]
07/01/10 101D 1010.91 [99]
??/??/?? Next secondary low dates : 09/17-09/30-10/13-10/26 (54, 63,72, 81)
1040.88 Aug 31
1039.70 Aug 27
1039.83 Aug 25
- The sequence number 54 did not show up in the last four samples, so 63, 72, and 81 has better odds.
- Each year in average has 251 trading days.
- 17/15/14 calendar weeks equals 82/72/67 trading days.
reference info
[i] Eric Hadik
- A 14-15 weeks cycle remains in control
chart:
http://www.insiidetr...y15DJIAChrt.jpg
free info in PDF:
http://www.insiidetr...10CyclePeak.pdf
web site:
http://www.insiidetrack.com/
[ii] Andre Gratian, Sun, Aug 29, 2010
- The 17-wk cycle has been very dominant in the past couple of years, is also due to make its low in October.
full text & charts
http://www.safehaven.../turning-points
( b ) Long PI date & 108 trading day cycle
108 trading days from 04/26 (index 1219.80) is 09/28
Use 04/26 as the reference date, the next long PI date also maps to 09/28. (prior post reported 09/20 was an error).
[2] Longer term
( a ) The wave structure since Marchs low (09) looks bullish.
Sep 7 2009, 04:46 PM, Post # 1
( b ) So far the pullback from 1219 (04/26) is considered a correction of a longer term bullish wave structure, with an unrealized middle term target 944-948.
Jul 11 2010, 07:38 PM, post # 21
( c ) Be aware the Bradley Siderograph unique signature in 2011, one year before the long awaited storm zone 2012-2014
chart:
http://indexcalls.co...44408_thumb.jpg (
Aug 29 2010, 10:31 PM, post # 235).
If the above chart is too small to read, Then, use Bradley Siderograph 2011
http://www.robertew....dley/br2011.jpg
Viewers may go over the Bradley Siderograph for the next 8 years and find out why 2011s is unique.
2010
2011 2012 2013 2014
2015 2016 2017 2018
( d ) reference info
Last Bull Standing 2011 - Cliff Droke, July 16, 2010
An excerpt: "The potential for a mini cyclical recovery bull market in 2011, and a once-in-a-century three year period of historic change, turmoil and dislocations to begin in 2012 and persist until 2014."
Full text


