Jump to content


Photo

Crafting the rhythms


  • Please log in to reply
140 replies to this topic

#41 stanley

stanley

    Member

  • Traders-Talk User
  • 167 posts

Posted 18 October 2010 - 12:52 AM

Crafting the rhythms series – 10/17/2010.

This is a closing post, the last one in this series.

archive
-----------------------------------------
Oct 3 2010, 09:27 AM Post #39
Overall comments:
Time window is going to close in the next few weeks for bearish scenario.
1175 is the pivot for higher numbers, it is a mean value between 1121/1229 in this chart

Apr 13 2010, 10:58 AM Post #1
1221 is a major Fibonacci retracement point, expects good rejection on initial assault.
---------------------------------

Note: 1221 is the mean value between 1229 & 1213, [refer to the chart in the archive]. The index marked a middle term high 1219.80 on 04/26.

On 10/13, index marked an intraday high 1184.83 (1185), it is the mean value between 1195 & 1175 (refer to the chart in the archive). In the fact the index did surmount the pivot 1175 so, on the next assault, index may reach 1229 in a way to be speculated. In other words, index may across this pivot point bi-directionally, one of the possibility is a quick downward movement to challenge the lower side gauge 1117. perhaps, cuts through 1117 and pricks 1112-1101, 1093-1084.

The King Wen’s sequence has an indiscernible relationship linking with the 20 calendar weeks cycle which, in turns, is about 0.382 (actual 0.384) for a length of 12 calendar months. A 20 calendar weeks cycle is equivalent to 96 trading days. A 96 trading days from July’s Low is around 11/15-16 +/-.

The wave structure since March 2009, in my perception, looks bullish. There is no sign it will terminate in near term. In other words, this wave series may reach 1256-1310 (see post #1, Apr 13 2010, 10:58 AM). The timing is hard to speculate. Two time windows (in 2011) in this chart can be a good guide.

Time table
Posted Image
TD - Trading Days.
[xx] - theoretical value.

#42 stanley

stanley

    Member

  • Traders-Talk User
  • 167 posts

Posted 26 December 2010 - 05:04 PM

Crafting the rhythms series II

The is the first post for the “Crafting the rhythms series II” 12/25/2010

About 2 months ago, the closing post for “Crafting the rhythms series” made the following speculation:
---------------------
Crafting the rhythms series – 10/17/2010. link
The wave structure since March 2009, in my perception, looks bullish. There is no sign it will terminate in near term. In other words, this wave series may reach 1256-1310
----------------------

One December 22, index crossed over 1256

Overall summary:

(1) Bullish gauge is 1265, target 1291-1310 with a few attempts.
(2) first support is 1197-1205, to be followed by the major cluster zone 1173
(3) bearish gauge is 1138.
(4) Timing chart -link-, be aware of leading/lagging possibility.

“Trend is up until it is not”
"It ain't over 'til the fat lady sings" ( http://en.wikipedia.org/wiki/It_ain't_..._fat_lady_sings )
“Patience is a virtue”
How to identify the trend top is a challenging task, basic criteria provides good hints, for example: “3 Key Signs Of A Market Top”

You may skip the following lengthy details

Dec 23 2010, 11:04 AM
http://indexcalls.co...o...st&p=622527

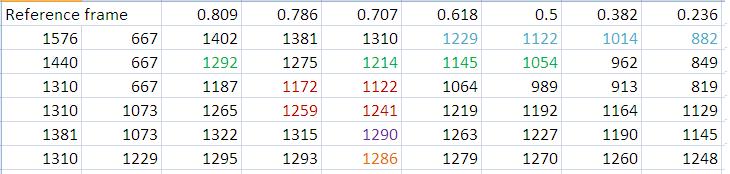
The significance of 1256.98 is very clearly revealed in the following chart.
chart: http://indexcalls.co...29464_thumb.jpg
On 03/17/08 index marked 1256.98 intraday low then bounced off. A few E-wave technicians labeled that was the end of wave "1" to complete the total 5 waves ending at 667 on 03/06/09. Now, the current wave "climbs over" wave "1", signals an overlap condition, the whole wave count needs to be reconciled. it implies a bullish development, [refer to post, dated Dec 21 2010, 07:56 PM].
A mechanic gauge sometimes is subjective. On 12/22, index plotted an intraday high 1,259.39, a few points higher than 1256.98. We may debate whether a few points "violation" is a decisive signal or not. Bear this “argument” in mind, let's dig a step deeper:

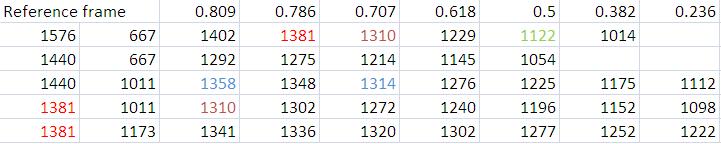
I saw an E-wave technician labeled the wave bounced off 1010 on July/01 as a 5 waves series. Use the wave count as is, the following chart shows a few possible terminal points.
chart: http://indexcalls.co...30831_thumb.jpg

The index is joggling around 1256, "peeking" at 1265. this is a very "annoying" condition. So, let's go one more step deeper:

----------------------------
Dec 7 2010, 07:40 PM link
My works suggest that the SPX 1265 (intraday low 03/17/08) is a critical pivot. As long as the index can surmount this pivot, next target is 1310 or even higher

summary (Jim Curry's) : (Jim Curry's chart: http://static.safeha...rry/19234_c.png )
Upper resistance 1310.55
Lower support 1136.04 ( has been tested on 12/15 (1234), 12/16 (1233) )
target 1243.16 - 1286.36 [SPX Cash]
----------------------------

Jim Curry set 180-day cycle target 1243.16 - 1286.36, The mean value for 1243.16 and 286.36 is 1264.76 (1265). so, 1265 is a reasonable gauge to say whether the index can reach 1310 or not. I see the pullback will be mild, the obvious support is 1200-1207, the bearish gauge is 1138.

Dec 21 2010, 10:12 AM
http://indexcalls.co...o...st&p=621998

By surmounting 1256.98, the wave since March 2009 gains one hierarchical level higher. Index takes out pivot 1265 also opens the gate to see 1310.

Apr 13 2010, 09:58 AM link
Crafting the rhythms series, No. 1 post
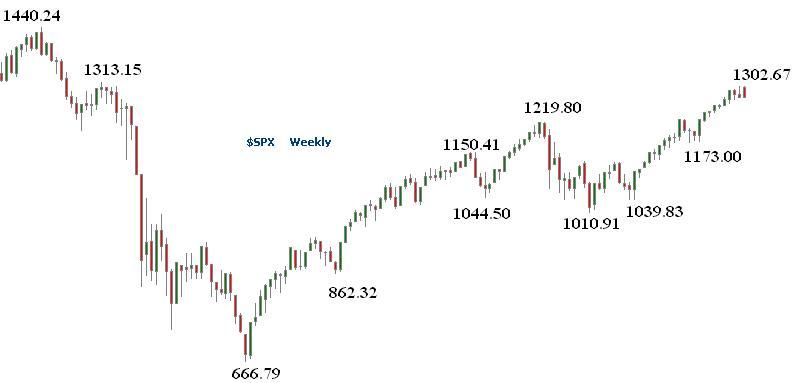
When index exceeds 1256.98 the wave status since March 09 may “separate” from the prior one (1756-->667) and become an individual segment. When the wave is becoming a separate segment, it is capable of reaching 1300 level. The half power point 0.707 from 667 to 1576 is 1310, very close to the High 1313.15 marked on 08/11/08


SemiBizz Dec 23 2010, 11:16 AM
http://indexcalls.co...o...st&p=622528

1265.12 SPX last high from 9/19/08
Lehman Bros Crash.
(insert 1: Lehman Brothers filed for Chapter 11 bankruptcy protection on September 15, 2008)
(insert 2: U.S. Stocks Rise, Erasing Decline Since Lehman Brothers Bankruptcy in 2008
Dec 21, 2010 1:40 PM PT link )

Dec 21 2010, 07:56 PM
http://indexcalls.co...o...st&p=622149

For academic discussion propose, I put here two of the charts from Michael Eckert,aka-Columbia1

(1) Posted by Michael Eckert,aka-Columbia1 on 12/21/10 at 1:04 PM
( web site: http://ewtrendsandcharts.blogspot.com/ )

chart: http://indexcalls.co...90211_thumb.jpg

(2) Michael Eckert,aka-Columbia1 - SPX, Long-term count
( chart link can be found in http://ewtrendsandcharts.blogspot.com/ title SPX, Long-term count )

chart: http://indexcalls.co...90232_thumb.jpg

The 5 wave count in (1) is part of the long term wave structure in (2).
wave 2 and wave 4 in (1) may not comply with the “RULE OF ALTERNATION” (II and IV are not the same structure ( http://www.wavecount...Application.pdf ). However, there is some ambiguity in the semantic of the definition that gives leeway for arguments. In additional, Wave 1 is a rising wedge, this seems a rare case in terms of a 5 wave structure. Anyway, in a straight forward read, let’s take this count as is. Wave 1 is from 1011 to 1129, length 118. Assume wave 5 top is 1256 (intraday high as of 12/21), an equal length (but not necessary has to be this way) wave will put index at 1256 – 118 = 1138 ... [the rest of it is into too details, skip]

Dec 13 2010, 11:25 AM
http://indexcalls.co...o...st&p=620341

An obvious RSI/Price divergence shows in the SPX weekly chart.
chart: http://indexcalls.co...68671_thumb.jpg

Dec 9 2010, 08:57 AM
http://indexcalls.co...o...st&p=619444

(A viewer AK2 reply to me): Contrary to Mr. Caldaro, McHugh says we approach the end game....

[(Robert McHugh ) There is the alternate possibility that wave (5) up has topped, however if so, we should have seen more power behind the decline over the past two days. So that remains an alternate possibility, not our top labeling. However, with the Daily, Weekly, and Monthly Full Stochastic all at overbought levels, we need to remain alert for a premature end to (5) up.

Thank You for your inputs

Wave truncation is rare. since the index marked an intraday high 1227.08 (11/05) and 1235.05 (12/07) respectively, the latter one is 8 points higher than the former one, so it does not favor a truncation. There is a margin for this kind comparison, If we allow 3%, the gauge come to the number I have mentioned, 1229 * 1.03 == 1265. 1229 * 0.97 == 1197, However, for bearish scenario, I prefer to see if the pullback can break 1138 decisively.
In September, McHugh did two public commentaries:
A History of Autumn Declines In the Dow Industrials
By: Robert McHugh | Sun, Sep 19, 2010 http://www.safehaven...dow-industrials
Trend-channel Analysis Suggest Stocks Are About to Fall
By: Robert McHugh | Sat, Sep 25, 2010 http://www.safehaven...e-about-to-fall

Dec 8 2010, 09:35 PM
http://indexcalls.co...o...st&p=619364

Tony Caldaro bull market call validation:
breach/surmount 1310, pullback but hold 1229 (rough number). why 1229/1310? (refer to the post, dated Dec 7 2010, 07:40 PM)
chart: http://indexcalls.co...41212_thumb.jpg

SPX bull market projection - by tony caldaro September 26, 2010
http://caldaro.wordp...ket-projection/

" (Tony Caldaro ) My best estimate, at this stage of the wave structure, is for a top around the previous SPX 1576 high by February 2012."
chart: http://indexcalls.co...73319_thumb.jpg


Dec 7 2010, 07:40 PM
http://indexcalls.co...o...st&p=618948

Jim curry
Technical Warning Signs Brewing!
http://www.safehaven...g-signs-brewing

For academic discussion, I made the following quotes from Jim Curry's work:

quote: the primary focus for mid-term players should be on the 180-day wave, which, as noted above, has a current upside target to 1243.16 - 1286.36 SPX CASH - a target that was originally triggered back in October. This range is not only the upside target for this wave - but is also the favored range to complete the current upward phase of this same cycle. Here is what this 180-day component looks like right now:
Posted Image
The bottom line with all of the above is this: the SPX should make a move into the 180-day target in the days/weeks ahead. However, the technical indications are starting to suggest internal weakness - which is consistent with what we should expect to see as this larger cycle starts to roll over, ideally occurring some point between now and early-January, 2011. Once this cycle does turn down, then once again we will be set up for the largest percentage correction seen since coming off the late-August low, a correction that is likely to be in the range of 7-10% off the top before bottoming out.
end quote

summary (Jim Curry's) :
Upper resistance 1310.55
Lower support 1136.04
target 1243.16 - 1286.36 [SPX Cash]

calculations
1229 = [0.618:1576|667]
upper resistance 1310 = [0.707:1576|667]
target 1286 = [0.707:1310|1229]
target 1243 = [0.707/4:1310|1229]
lower support 1136 = [0.5:(1286+1243)/2|1011]
(these calculations provide hints how index performs the Zig-Zag)

Discussions:
The scope should not only focus on how low the index can reach but also what will happen when the expected secondary low is reached; My works suggest that the SPX 1265 (intraday low 03/17/08) is a critical pivot. As long as the index can surmount this pivot, next target is 1310 or even higher. In near term, No matter index will surmount 1243 or not, the pullback will be mild. Supports are 1205, 1167, 1138 (rough estimate, 0.236.0.382,0.5 of [1265|1011]) and 1108-1085. I believe the market is under cross currents, unsettling, therefore, the index behavior after January/2011 is premature to speculate. Two time windows in 2011 ( this chart ) will give good hints.

[the rest of this post is into too details, skip]

Astro:

The Entertainment Department

Bradley Model, Siderograph by year, 1993 - 2019
http://www.robertew....l/bradley.shtml

Constructing The Siderograph
http://gamma.dhs.org...es/bradley.html

Dec 21 2010, 10:12 AM
http://indexcalls.co...o...st&p=621998

Free Amanita Newsletter 12/21/10 : Amanita Investor’s Guide 2011 Before the End of Times
7. Stock markets: bears will be slaughtered
http://www.amanita.a...ewsletter-e.pdf

Dec 18 2010, 11:23 AM
http://indexcalls.co...o...st&p=621428

complied info:
in terms of human life span , the historical event has a large aberration (to a specific time mark.) For example: Time mark December 21, 2012. The precise alignment of the solstice point (the precise center-point of the body of the sun as viewed from earth) with the Galactic equator was calculated to occur in 1998 (Jean Meeus, Mathematical Astronomy Morsels, 1997). The solstice point slowly but surely moves westward through the stars at about one degree per every 72 years. Put sun’s diameter (equals about 1/2 degree.) into consideration, the Galactic Alignment "zone" is 1998 +/- 18 years = 1980 - 2016. This is "era-2012." ( From Ronald Reagan, 1981 -- ???? 2016, end of an empire? ) http://alignment2012.com/whatisga.htm
http://earthsky.org/...c-plane-in-2012

Dec 17 2010, 12:32 PM
http://indexcalls.co...o...st&p=621273

Here is a web site shows the current date in the Mayan Date
http://www.sacred-te...cal/mayacal.htm

Current Mayan Date in Long Count format
baktun 12 katun 19 tun 17 uinal 17 kin 5 == December 17, 2010

The "roll over" of the most significant number (Baktun) from 12 to 13 will take place on December 21 2012. The date draws lots attention. To know more about what this means it is interesting to make an astrological chart of the December solstice of 2012 ....

Posted Image

Due to the long period (precessional cycle, 25800 years – 26000 years) of the Earth axis rotation, the position of the December solstice moves towards the Galactic Equator.

"Position A is where the December solstice sun was in relation to the Milky Way some 3,000 years ago. Position B is 1,500 years ago. And position C is "era-2012", when the December solstice sun has converged, as a result of the precession of the equinoxes, with the exact center-line of the Milky Way (the Galactic equator).

chart: http://indexcalls.co...18769_thumb.jpg

precessional cycle http://en.wikipedia....wiki/Precession
The Earth goes through one such complete precessional cycle in a period of approximately 26,000 years, during which the positions of stars as measured in the equatorial coordinate system will slowly change; the change is actually due to the change of the coordinates. Over this cycle the Earth's north axial pole moves from where it is now, within 1° of Polaris, in a circle around the ecliptic pole, with an angular radius of about 23.5 degrees (or approximately 23 degrees 27 arc minutes [2]). The shift is 1 degree in 72 years, where the angle is taken from the observer, not from the center of the circle.

2012 AD - Mayan Calendar Galactic Alignment
http://www.ancient-w...s.com/2012.html
What is the Galactic Alignment?
http://alignment2012.com/whatisga.htm
Precession of the Equinoxes
http://www.crystalin...precession.html
The Precessional Cycle of the Holy Cross
http://www.lunarplan...ie300Frame.html
Celestial Alignments
http://www.crystalinks.com/2012.html
THE ASTROCARTOGRAPHY OF THE DECEMBER WINTERSOLSTICE OF 2012
http://www.astrology...cartography.htm
The End of Mayan Civilization
http://www.thenagain...as/endmaya.html
The Mayan calendar
http://www.webexhibi...ndar-mayan.html
http://www.crystalin...ancalendar.html
What is the Long Count?
http://www.webexhibi...ndar-mayan.html
Current Mayan Date
http://www.sacred-te...cal/mayacal.htm
Mesoamerican Long Count calendar
http://en.wikipedia...._Count_calendar

Dec 17 2010, 11:31 AM
http://indexcalls.co...o...st&p=621257

'The dragon exceeds the proper limits;—there will be occasion for repentance"
when things have been carried to extremity, calamity ensues.

Yi Jing [I Ching]: The Book of Changes http://www.yellowbri...it/yijing01.php

perpection: Year of Dragon (2012) becomes Year of Snake (2013), from “flying” to “crawling”

chart: http://indexcalls.co...14763_thumb.jpg

Dec 10 2010, 10:37 AM
http://indexcalls.co...o...st&p=619712

3 February 2011 – 22 January 2012: Metal Rabbit
http://en.wikipedia....Rabbit_(zodiac)
Posted Image

Nov 30 2010, 11:37 AM
http://indexcalls.co...o...st&p=617104

The End of the Middle Ages - May 22, 1453 AD

The 10 Greatest Eclipses in History
http://www.mendhak.c...in-history.aspx
Fall of Constantinople
http://en.wikipedia...._Constantinople

Nov 28 2010, 01:29 PM
http://indexcalls.co...o...st&p=616717

THE HERBST NEWSLETTER
Bill Herbst, Issue #125 – August 2010

An excerpt
full text: http://www.billherbst.com/News125.pdf

Having studied in depth the various cycles of civilization astrology for nearly a decade, I’ve deciphered enough of the symbolic coding to know that the pair of successive long-term alignments [see Note] that make up the primary symbolic indicators of the archetype field from 2008-2020 present us with a two-step dance whose second phase is very different from its first.

(first phase)
From 2008 through 2011, during the life of the Saturn-Uranus-Pluto T-square, whatever happens to push civilization closer to the edge will be resisted by the powers-that-be to the point of denial of anything changing at all in the way we live our lives and conduct our affairs. [ skip..... ]

(Second Phase)
Then, from 2012 on, when the Uranus-Pluto first-quarter square finally hits critical mass and takes over center stage, the second phase repudiates the first as we enter an extended period of real and dramatic change............


Note:
In the first phase, other than those nature disasters, the world experienced:
The collapse of the US housing bubble, European sovereign debt crisis..... ( Financial crisis of 2007–2010 http://en.wikipedia....ign_debt_crisis )

Overall picture
The Next 15 Years: 2005 to 2020
http://www.astrology...ext15years.html

First Phase:
The Saturn-Uranus Opposition Series -- 2008 - 2010
Exact: 5 times
http://www.astrology...turnuranus.html
11/04/08 02/05/09
09/15/09 04/26/10
07/26/10

Second Phase:
Uranus-Pluto Squares - 2008 to 2019
Exact: 7 times, 7 exact conjunctions is fairly unusual.
http://www.astrology...ranuspluto.html
06/24/12 09/19/12
05/20/13 11/01/13
04/21/14 12/15/14
03/17/15

#43 stanley

stanley

    Member

  • Traders-Talk User
  • 167 posts

Posted 10 January 2011 - 01:51 AM

Crafting the rhythms series II 01/09/11

Review – no change
----------------------------------------------------
Dec 26 2010, 02:04 PM Prior post

Overall summary:

(1) Bullish gauge is 1265, target 1291-1310 with a few attempts.
(2) first support is 1197-1205, to be followed by the major cluster zone 1173
(3) bearish gauge is 1138.
(4) Timing chart -link-, be aware of leading/lagging possibility
----------------------------------------------------

I did a few posts after Dec 26, let me rearrange the posting order so the context can be read smoothly.

Jan 1 2011, 10:55 AM
link
By adding in the latest weekly data (note: last week of December), the overall mechanical signals does not suggest a deep pullback ( > 100 points) in the short term frame. Trend reversal requires a lower high in the chart, not there yet.

chart: http://indexcalls.co...08333_thumb.jpg

status:
moving average: bullish, 20SMA 1255 > 50SMA 1223> 200SMA 1148 [note: data 01/07)
resistance zone : bullish target 1291-1310.
supports (short term) 1243, 1218-1229, (longer than "short term') 1205-1197, 1173.

Jan 6 2011, 12:39 PM
link
cluster zone 1279-1281 serves as a resistance.
A rejection at this zone and index dives below 1256, I consider this is the failure of the first attempt to 1291-1310
-----------------
Posted on: Jan 3 2011, 12:35 PM link
Intraday resistance is 1279 with reference to [0.618|1310:1229], support 1269.
Intraday resistance is 1281 with reference of 2x [1227-1173]
-----------------

(Insert)
Link provided by voltaire

David Knox Barker
By: David Knox Barker | Sat, Jan 8, 2011
An excerpt:
"I would be remiss in not pointing out that the S&P 500 price target of 1278.95 is the inverse golden price target in the current Level 2 Fibonacci Dynamic Web price grid. These are the sort of targets used to indentify precise entry, exit and stop loss targets.
Global Stock Market Cycle Forecast 2011"

full text: http://www.safehaven...e-forecast-2011


Jan 2 2011, 10:20 AM link

Posted Image

The upper section of the chart was the speculation I did in last June. (For simplicity, I removed the wave labeling. The essence is the major FIB points). There is not enough observed Zigzag points to say 1440 will be referenced in near term.

(Insert)
You may glance over the yearly Siderograph from 2008 to 2014. The singular turn in June 2011 looks quite different from the adjacent years’ Siderograph. You have to sigh why it is in such an indiscernible way. May be the stock market actions in the coming February, and June 2011 will give us good hints to align the Fibonacci reference frame comfortably.

(Before go further discussions, please take note for the following Astro event series, The Saturn-Uranus Opposition and Uranus-Pluto Squares)

The Saturn-Uranus Opposition Series -- 2008 - 2010
Exact: 5 times
link
11/04/08 02/05/09 09/15/09 04/26/10 07/26/10

Uranus-Pluto Squares - 2008 to 2019
Exact: 7 times, 7 exact conjunctions is fairly unusual.
link
06/24/12 09/19/12 05/20/13 11/01/13 04/21/14 12/15/14 03/17/15

This link ( link creditor: Swiss Trader ) routes you to Joe Russo's blog (Elliott Wave Technology) with decent E-wave works (Elliott Wave, the Next Generation part II, Monday, December 20, 2010). Three E-wave propositions has been explored; Now, compares those propositions with the Uranus-Pluto Squares 'schedules', which propositions has the better odd?

The Saturn-Uranus Opposition Series, and Uranus-Pluto Squares can be viewed as two blasts. The impetus would spur profound repercussions. Perhaps, my perception is rather impressionistic than quantitative. There is some contour blurs in the painting.

Jan 4 2011, 09:14 AM
link
After I read Joe Russo’s work one more time, I think, other than those looks authoritative wave nomenclature, the key answer is still floating in the air.

For the academic discussion purpose, I compiled his wave propositions into one chart, I put my chart I did in late June in the middle to the right of the chart.

Let’s move the cursor to the year of 2012. A time line about 24 months from now. In Joe’s proposition 1, DOW will reach a peak in 2012. In proposition 2 and 3 DOW will reach a trough with different severity; The peak of proposition 1 in 2012 is not hard to figure out, it is in the structure of (a),( b ),( c ) . Usually ( c ) will be in the FIB ratio of (a) . Proposition 2 and 3 follows the same intuition.
Here is my take: in order to perceive the status in 2012 in a more comfortable way, the key embeds in the actions in the coming February and June. To elaborate the thoughts, Let me use the S&P500 index as a guide. In between Feb. and June, see if index can reach the short-to-middle term secondary peak around 1291-1310. If the pullback from the secondary peak is lower than 1138 decisively, the bullish scenario fades; In a more bearish tone, If Index fails to reach 1291-1310, it dives below 1138 decisively, bulls are in trouble.

Posted Image
charts (left) courtesy: Joe Russo December 20, 2010, link
large size

Sep 4 2010, 10:22 AM
link
Last Bull Standing 2011 - Cliff Droke, July 16, 2010
An excerpt:
"The potential for a mini cyclical recovery bull market in 2011, and a once-in-a-century three year period of historic change, turmoil and dislocations to begin in 2012 and persist until 2014."
full text: http://www.gold-eagl...roke071610.html

#44 stanley

stanley

    Member

  • Traders-Talk User
  • 167 posts

Posted 14 January 2011 - 02:50 PM

Crafting the rhythms series II 01/14/11

S&P500 intraday high 1292.22 @ this writing

Index breaks 1291 enters the target zone 1291-1310.
Since 1292 has been breached, from the following FIB table you can see clearly
that the reference frame [1440:667] is now activated.
The support zone 1190-1229 becomes critical gauge for assaulting 1381.

Jan 13 2011
Posted Image

Jan 2 2011
Posted Image

Crafting the rhythms series Apr 13 2010
When index exceeds 1256.98 .... (therefore) ...
it is capable of reaching 1300 level. The half power point 0.707 from 667 to 1576 is 1310

Crafting the rhythms series II Dec 26 2010 , , Jan 9 2011
target 1291-1310

Crafting the rhythms (waves)

Quotes of Claude Monet

They are bringing the canvases to me one after the other. A color that I had found and sketched on one of these canvases yesterday reappears in the air. I am quickly given this painting and strive to fix this vision as permanently as possible. But it usually vanishes as fast as it sprang up, making way for another color I had already painted days ago on another study instantly put in front of me... And that is the way it is all day long."

These landscapes of water and reflections have became my obsession. They are far beyond my old man powers and despite everything I want to succeed in conveying what I feel. I destroy some... I start over again... And I hope something will finally come from so many efforts."

Whereas you are philosophically seeking the world in itself, I am simply focusing my efforts on a maximurm of appearences in close correlations with unknown realities."

http://www.intermone...re/pontjapo.htm
http://www.intermone...re/nymphea1.htm


#45 stanley

stanley

    Member

  • Traders-Talk User
  • 167 posts

Posted 30 January 2011 - 11:50 PM

Crafting the rhythms series II 01/30/11

I split the material into two sections.
This post is the first section.

Overall summary:
(1) bullish gauge 1265, bearish gauge 1140
(2) resistance 1305-1307, 1310-1322
(3) major support 1191-1223. critical support 1171.
(4) Timing chart -link-

Review:
------------------------------------------------------------------
Dec 26 2010, 02:04 PM link
(1) Bullish gauge is 1265, target 1291-1310 with a few attempts.
(2) first support is 1197-1205, to be followed by the major cluster zone 1173
(3) bearish gauge is 1138.
(4) Timing chart -link-, be aware of leading/lagging possibility.

Jan 13 2011, 11:23 AM link
S&P Index is in the zone for correction, it is waiting for a catalyst

Jan 14 2011, 11:50 AM link
The support zone 1190-1229 becomes critical gauge for assaulting 1381
Posted Image
------------------------------------------------------------------

On 01/28/11, index marked an intraday high 1302.67, then, it reversed, and marked an intraday low 1275.10. Its nearby Fibonacci point is 1275. While one may be anxious to say that the uptrend may have ended on 01/28/11, there is an embedding signal needs to be explored: Use the reference frame [1381-1011], 0.786 retracement put index at 1301.82. where 1381 is an unrealized Fibonacci point, 1011 was the low observed in July, 2010. If use the theoretical reference frame [1381-1014], 0.786 retracement would put index at 1302.46. It seems 1381 is out there, to be reached on the next assault; At this moment, imho, as long as index does not violate the bearish gauge, there is no confirmation the uptrend have ended. The risk vs reward is always a compromised game; At minimal, Index has poked into the suggested zone 1291-1310, and a correction may have commenced.

Two popular simple moving averages (SMA) can serve as good speculation guide. As of 01/28 closing, 50 day SMA is @1247.79, ascends 1.69 points per trading day, after 2 weeks, it may climb to 1263 +/-; 200 day SMA is at 1155.82, ascends 0.56 points per trading day, after 2 weeks, it may reach 1161 +/-. [For simplicity, calculation uses very simple linear concept]. In a rough sense, the bullish gauge is around 1265.

Use 1302.67 as a pivotal point, we can derive 3 sets Fibonacci reference frames. Those FIB retracement points can be good guide for identifying the intermediate level supports. The overlap point is 1223 but it is premature to highlight its significance.

(1) [1302.67-1010.91 | L=291.76]
0.382@1191

(2) [1302.67-1173.00 | L=129.67]
0.236@1272
0.304@1263
0.382@1253
0.500@1238
0.618@1223
0.786@1201

(3) [1302.67-1039.83 | L=263.84]
0.236@1241
0.304@1223
0.382@1202
0.500@1171
0.618@1140 The bearish gauge

01/30/2011 05:14 PM
Chart helps to refer to the aforementioned reference frames.
Posted Image

Barchart.com provides a handy projection table: http://charts.insidestocks.com/procal.asp?sym=$SPX

(quotes are in italic) Elliott said that "because man is subject to rhythmical procedure, calculations having to do with his activities can be projected far into the future with a justification and certainty heretofore unattainable." ( link ). However, R. N. Elliott's analysis of the mathematical properties of waves and patterns eventually led him to conclude that "The Fibonacci Summation Series is the basis of The Wave Principle.". In this sense, Use the Zigzags to find Fibonacci terminal points is a short cut for swing trade. As a foot note, The Peter Principle is a special case of a ubiquitous observation: anything that works will be used in progressively more challenging applications until it fails. This is "The Generalized Peter Principle", ( link ) . That says, It is imperative that (one) understand the limitation for each engaged method, a way to avoid "self haunting".

#46 stanley

stanley

    Member

  • Traders-Talk User
  • 167 posts

Posted 02 February 2011 - 02:26 PM

Crafting the rhythms series II 02/01/11

I split the material into two sections.

First section, 01/30/11

This post is the second section

Overall summary:

(0) Target 1291-1310 (Dec 26 2010)
(1) bullish gauge 1265, bearish gauge 1145
(2) resistance 1310-1320
(3) expect a correction with major support 1196-1229. critical support 1175.
(4) Timing chart -link-

Posted Image

1310 was a “long term” target when I made this call on Apr 13 2010,. Now, Index has traveled over 1292 decisively so the reference frame [1440:667] has been activated. From the above table, one can tell the focus shall aim on [1440:1011],[1381:1011] and [1381:1173] respectively. It seems 1381 is out there, to be reached on the next assault. I speculate the Zigzags will deploy very similar dynamics in the zone 1256 to 1310 and 1358 to 1402. Should index climb over 1358 decisively , then 1381 become a pivotal gauge accordingly. In wave perspective, a sub wave moved from 1039.83 (08/25/10) to 1227.08 (11/05/10), total length 187.25 points. then, index retraced back to 1173.00 (11/16/10). from there, an equal length movement would put index at 1360.25. I can draw a few possible routes. But, I respect market take its own pulse, it is better watching the near term trajectory before submitting a draft.

A daily phone chatter asked me: “I got bored with your ‘wave looks bullish’ melody, can you come out some bearish one? I can’t wait any longer, hmm now”

Here is a textbook chart (From R.N. Elliott's essay, "The Basis of the Wave Principle," October 1940. http://en.wikipedia...._Wave_Principle )
Posted Image
The top wave exhibits wave count 1,2,3,4,5,A,B and C. In an open system, wave 1-5 belongs to a wave that is one scale larger, wave (1), wave A-C belongs to a larger wave (2), wave C is the beginning point of a larger wave (3).

Insert:
Here's a table showing An Elliott Wave Notation Scheme: ( posted by Chip Anderson )

An open system has a characteristic that each corrective wave will not descend below an impulse wave , the whole system grows under a simple assumption that there is enough energy (money, production output, GDP growth, .... etc. ) to supply the ever growing waves. So, this is the problem for plotting a bullish wave series with multiple years time span into the future. “Hope” and confidence cannot hold a mirage forever. The index ‘prosperity’ should come from a real growth in the underlying economy and/or there is an inflation in the fait money, sounds paradoxical but intuitively logical.
Let’s see what expert says:
---------------------------------------
Bernanke : All signs show that we are recovering
Ben S. Bernanke FDIC panel speech excerpts
January 13th, 2011 5:27 pm ET
By Semion Feldman, NY Stock Market Examiner
http://www.examiner....s#ixzz1BK8gpiAt
We are not legislators, but rule makers. Economy is getting better: S&P up 20% previous year, small cap stocks did even better, around 30%. All signs show that we are recovering. I am very optimistic regarding the economy. We see some improvement on labor market. Still there is a lot of uncertainness in the world. GDP growth 3-4% is reasonable expectation for this year, but not enough to reduce unemployment at a desire level.”

Davos: Dr. Doom Says Glass Half Full/Half Empty
January 26, 2011, 7:34 AM ET
http://blogs.barrons...fullhalf-empty/
On the positive side, he acknowledged that not only is the global economy recovering, the latest data show it to be accelerating. Secondly, the risk of a double dip is lower than it was last year....
---------------------------------------

An old Wall Street proverb says that the stock market “climbs a wall of worry” to march into bullish territory. In an “allegedly” strengthening economy, the one owns a diversified core position may not have this kind dilemma. he/she will sit on the fence indefinitely.

Let me 'drift' away from the wave structure, MACD/RSI ... TA indicators, put the focus on another jungle, the statistics wonderland. Please bear in mind that every method has its limitation, the reason why I mentioned the Peter Principle in the first part of this post. Both the western and occidental has the same idiom: ‘can't see the forest for the trees’ (can't see the wood for the trees), I am just looking for a weathervane’s directional guide .

- Correlation and dependence http://en.wikipedia...._and_dependence
- U.S. Industrial Production and Capacity Utilization Index http://www.federalre...s/g17/About.htm

How to calculate correlation accurately
by John on November 5, 2008
http://www.johndcook...ion-accurately/

raw data: the monthly Industrial Production index, S&P500 index, from 01/09-12/10
http://research.stlo...2/series/INDPRO
http://www.economagi...e/fedstl/indpro

Let’s see the correlation between S&P500 & U.S. Industrial Production Index
chart: link

Use the equations (from the aforementioned link), the correlation coefficient is 0.71391.
details in this table

The data set has only 24 members, one may enter the whole data set manually via this handy calculator
For illustration purpose , here is the result

Correlation coefficients whose magnitude are between 0.7 and 0.9 indicate variables which can be considered highly correlated. Correlation coefficients whose magnitude are between 0.5 and 0.7 indicate variables which can be considered moderately correlated ( from http://www.andrews.e...m611/edrm05.htm )

discussion:
(1) It is only a directional guide, cursory view.
(2) S&P500 index presents some volatilities that degrades the correlation. It also carries some other dependency that is beyond my scope . Lee Alder suggested the correlation through ISM & Factory orders, ISM vs. S&P chart, and Factory order vs. S&P (links with permission)
(3) The IPI forecaster (read web info for creditability) suggests IPI will decline after this coming May link

In the Alice wonderland, the White Rabbit is the first Wonderland character Alice encounters. He appears at the very beginning of the book , wearing a waistcoat, and muttering "Oh dear! Oh dear! I shall be too late!" However, the White Rabbit is confident enough about himself ... In a way, he is some kind of a guide through Wonderland for her, only unintentionally.
http://en.wikipedia....ki/White_Rabbit
http://www.alice-in-...ite-rabbit.html

Jul 23 2010, 02:26 PM
Year of the Tiger
15 February 2010 – 2 February 2011
But, ... "Tail" Down or Up? which one?
Posted Image

Feb 16, 2010 open 1,079.13

3 February 2011 – 22 January 2012: Metal Rabbit
http://en.wikipedia....Rabbit_(zodiac)
Posted Image

#47 stanley

stanley

    Member

  • Traders-Talk User
  • 167 posts

Posted 11 February 2011 - 03:27 PM

Crafting the rhythms series II – 02/11/11

(0) Index has ran over the target 1291-1310 set on Dec 26 2010
(1) bullish gauge 1265, bearish gauge 1145
(2) resistance 1336-1358
(3) expect a correction with major support 1205-1220. critical support 1175.
(4) Timing chart -link-, Time has its magic, getting closer to that point.

Those vigilant observers are waving many red flags (wrong color for bulls?), they shout loudly but not enough to keep bulls docile. Bulls took out 1310 decisively. this is a strong movement. Terminal points 1336,1358,1381 is becoming 'visible', perhaps, reachable before the correction kicks off finally.

From the following table you can tell there is only a few "boxes" bull need to fill in.
Posted Image
the chance a pullback below 1175 is getting slimmer. to prevent entering short positions prematurely, it is safer to have synchronized confirmation from different indicators, for exmaple Bradley-Siderograph turn sate in conjuction with the rolling down of weekly $NYAD ( http://stockcharts.com/freecharts/gallery.html?$NYAD )

[A] King Wen's sequence
Here is the up-to-date table using the King Wen's sequence (81,126,63,108,90,99,54,117,72)
Posted Image

You may read the table in this way:
For High
02/18/11 72TD ????.?? from last high date 11/05, 64 trading day maps to 02/08
03/04/11 81TD ????.??
03/17/11 90TD ????.??

For Low
11/16/10 96TD 1173.00
02/16/11 63TD ????.?? from last Low date 11/16, 63 trading day maps to 02/16
03/02/11 72TD ????.??
03/15/11 81TD ????.??

-As of 02/11, it is 67TD from 11/05, it within the margin set by 63TD and 72TD
-Market will close on Washington's Birthday (Presidents' Day), February 21, 2011
-High and Low is mutual exclusive event, there is a separation in time.

Background info
------------------------------------
Jan 31 2010, 12:56 AM link
Posted Image
The King Wen's sequence has been studied by many historians and applied in Numerology. I found a nice paper written by J.M. Berger , title “The 108 in King Wen's Sequence“ [3]. In his paper, he suggested a King Wen circular arrangement of the ba gua (eight trigrams). The King Wen ba gua contains a "magic square" number scheme. I found the numbers correlates the 105/109 trading day cycle and its harmonics.

[1] The King Wen sequence (文王卦序, King Wen hexagrams divination sequence)
http://en.wikipedia....ng_Wen_sequence
[2] King Wen: Change And Symmetry
http://iching.egople...w-symmetry.html
[3] The 108 in King Wen's Sequence By J.M. Berger
http://iching.egople.../hidden108.html

[B] Long multiple PI
Here is the up-to-date table
Posted Image

SPX marked a major Trough on March 3, 09, a secondary high on April 26, 10. Unfortunately, This Long multiple PI projection does not suggest the set date will be a major or secondary valley/peak. The Inversion is another headache, we will need different indicators (such as accumulative Advance/Decline rolling) to judge. It is interesting to note that the King Wen sequence and Long multiple PI tags the two important Bradley-Siderograph turn Date 02/17, 07/28-30; The time span between this two turn date is about the length for one 104-107 trading day cycle

background info.
Let me repost some old works

Oct 24 2009, 02:45 PM link

US Stock Market "monumental" dates:

* Black Monday, October 19, 1987
* Millennium Internet peak (SPX), March 24, 2000
* First 4 year cycle low since millennium, October 10, 2002
* The apex of Great Reflation, October 11, 2007
* The first Trough since the Great Reflation, March 6, 2009

By converting the trading days into PI based multiples, a set of whopping numbers pop off!

For example, there are 3144 trading days from Black Monday to millennium Internet peak (SPX), equals 1000 * PI [ 3.14159265... ]
These PI based multiples are within the numerical margin of the following Fibonacci numbers
1 2 3 5 13 21 34 55 89 144 233 377 610 987 1597 2584 4181 6765 .......
Posted Image


[C] Bradley-Siderograph
For academic discussion, I compiled two charts with the courtesy works from:

NYSE Advance/Decline http://stockcharts.com/freecharts/gallery.html?$NYAD
Bradley-Siderograph 2007 - 2010 archive - Manfred Zimmel - Amanita Market Forecasting
Pitt Galford’s Bradley model AUNEGL.com via Robert's Investing http://www.robertew....l/bradley.shtml

into the following two charts:

chart A
chart B

Bradley-Siderograph missed two major events. In the past records, the Bradley Siderograph turn date has lead/lag phenomenon, The Turn action requires the confirmation from the weekly $NYAD sentiment indicator. Do you agree the roll off from a higher position in the A/D line also imply a relative larger downward movement? Does the siderograph convey the size of future market moves?

background info:
comments: There are there nested questions:
( a ) The successful capture rate of the turn date prediction?
( b ) When a Turn take place, what is the successful capture rate the turn direction follows the graph slope? according to Manfred Zimmel , 53%.
( c ) In a successful capture, a Turn take place, regardless the inversion, the question is how useful the magnitude signal can deliver?

(1) Bradley-Siderograph archive 2007 - 2010 - Manfred Zimmel - Amanita Market Forecasting link[/link

Bradley 1852-2040
After this short-term view now to a very long-term one. Below please find the Siderograph chart 1852-2040 (calculated with the „Market Trader" by Alphee Lavoie):

chart: http://www.amanita.a...bb8f359a402.gif

The formula assigns harmonic angles (60°, 120°) a positive value and disharmonic angles (90°, 180°) a negative value, the sum of all values is the chart as you know it. The lower, the worse the (economic) situation on average. The all-time low was in 1931 during the Great Depression, the model was also very low in 1875 after the crash of 1873, and in 2010 we are approaching the level of 1875. Isn't it interesting that the two historic models for the current situation are the years around 1931 and 1875? The Bradley low of the past 500 years was in the 1640s by the way, at the end of the Thirty Years' War (1618-1648) and after the first speculative bubble in history had burst (1637 tulip mania in Amsterdam). The reason for the low in 2010: the massive tension angles between the slow planets (T-square, partly even Grand Cross).


(comments: what is the time window width for such a long term data?)

(2) Bradley Model Frequently Asked Questions link

13. Does the Siderograph convey the size of future market moves?
My thoughts: The result of Bradley's work was not a consequence to predict or forecast magnitude of market moves; rather my understanding of his research and real-time experience since 1998 further convinces me of that. Therefore, I would not place any significance on a Bradley Indicator forecast of a number of market move points move in any average, i.e., Dow Industrials, S&P 500, NASDAQ, etc. My experience is that Bradley's value is in determining the overall trend, and I would further quantify that as intermediate to long-term rather than short-term


(3) 2010 copyright aunegl.com - Bradley Stock Market Prediction Model
Peter Eliades Stock Market Cycleslink

Eliades also wrote "Theoretically, the dates of the turns in the Bradley are more important than the actual magnitude of the moves..


(4) Bradley Siderograph archive 2003-2006 - Manfred Zimmel link

I have already been thinking about dropping the chart altogether and only publish the dates to avoid misunderstandings, however this has the major advantage that the magnitude of a turning point gets entirely lost (among other drawbacks), that's why I continue to release the chart.

The polarity was called 18 times (P=53%) and missed 16 times (P=47%). That's almost like throwing the dice, while the results do point in the right direction the deviation from the 50% to be expected by chance is by no means statistically significant, so one can only conclude that the Bradley Siderograph does not reliably predict whether a turning point will be a high or a low - only the date matters..


Closing:

Those genuine philosophers already ceased, they are unreachable. Perhaps we heard too many narrators’ voices, those Voices were not from the genuine sages.
Yeah! 'Theory is right, “they” interpreted it wrong.'

Quotes
Efficient-market hypothesis
In finance, the efficient-market hypothesis (EMH) asserts that financial markets are "informationally efficient". That is, one cannot consistently achieve returns in excess of average market returns on a risk-adjusted basis, given the information publicly available at the time the investment is made. [ http://en.wikipedia....rket_hypothesis ]

By this reasoning, if successful market forecasts were possible, investors would buy (or sell) when the method predicted a price increase (or decrease), to the point that prices would rise (or fall) immediately, thus destroying the profitability and predictive power of the method. In efficient markets, knowledge of The theory among traders would lead to the disappearance of the very patterns they tried to anticipate, rendering the method, ineffective [ http://en.wikipedia...._Wave_Principle ] ( modified words in this color )

#48 stanley

stanley

    Member

  • Traders-Talk User
  • 167 posts

Posted 13 March 2011 - 11:48 PM

Crafting the rhythms series II – 03/12/11

index moved as expected but with much slower downward pace.

Review

Index marked an intraday high 1344.07 on February 18, then reversed. As of 03/11 close, index registered a 3.9% ‘correction’.
-----------------------------------------------------------
Crafting the rhythms series II – 02/11/11
(0) Index has ran over the target 1291-1310 set on Dec 26 2010
(1) bullish gauge 1265, bearish gauge 1145
(2) resistance 1336-1358
(3) expect a correction with major support 1205-1220. critical support 1175
Bulls took out 1310 decisively. this is a strong movement. Terminal points 1336,1358,1381 is becoming 'visible', perhaps, reachable before the correction kicks off finally
-----------------------------------------------------------

short term

(1) local frame 1229:1310, support at 1293-1295, resistance 1310-1317.

From the table, you can see why 1293-1295 is important. It is the mirror point (0.786) out of local frame 1229-1310, 0.5 @1270.

Posted on: Mar 10 2011, 07:52 AM link
Jan 30 2011, 08:50 PM
Posted Image

(2) chart pattern

Mar 10 2011, 07:35 AM link
Posted Image

more discussion: The Bearish Diamond Formation
by Richard Lee
http://www.investope...DiamondBear.asp

Fibonacci retracements

(1) bullish gauge 1265

Use the frame Low 1010.91 (07/01/2010) : High 1344.07 (02/18/2011)
0.236 @1265.44
The time length from 07/01/2010 to 02/18/2011 are 157 trading days, 0.5 of 100 * PI. From this long multiple PI table, February high didn’t synchronize with the “prime” time mark, could be a secondary event, a classical harmonic behavior.

(2) Fibonacci cluster

Zone 1272-1277 exhibits strong support, there is an open gap 1289-1286 (rough numbers) .

Feb 2 2011, 11:26 AM
Posted Image

(3) Zigzags cursory view

The center line is 1309 (1310), upper rail 1381, and lower rail 1228(1229).

Jan 2 2011, 10:20 AM
Posted Image

Posted on: Feb 24 2011, 09:44 AM
link
This downward move may hit 1229-1214. When index, indeed, hits 1214, will review the possibility to see 1175 or even lower numbers; The immediate resistance is 1317, also a pivot to nullify near term bearish call, supports are 1272-1277, 1252.

Timing

(1) near term

King Wen's sequence (81,126,63,108,90,99,54,117,72)

Feb 24 2011, 09:44 AM
Posted Image
Posted Image

For High
02/18/11 72TD 1344.07
03/17/11 90TD ????.??

For Low
11/16/10 96TD 1173.00
03/11/11 79TD 1291.99 ??
03/15/11 81TD ????.??
03/28/11 90TD ????.??

Since High & Low is mutual exclusive, one confirmation voids the opposite one intuitively.

The material for King Wen's sequence can be found in the prior post. The 'primary' number 108 links with the 104.5 trading day cycle ( 100 * PI / 3 ), the numbers in the sequence has no particular order, each one may correlate with a harmonic; Advance players use the Ying/Yang status in the sub-matrix to derive the next movement, a process that is highly speculative & subjectional. this area is beyond my scope.

(2) middle term

There are three timing stamps in the near to middle term time frame, Feb/March (in progress), April/May, and June/July. It is hard to sort out the relationship; In the fundamental side, there are decisions to be made about the national debt ceiling, QE3 .. etc. Technicians has different views for the next 1-2 quarters, Here is a quote from Jim Curry's work.

Stock Market Cycles Looking for a Peak!
By Jim Curry http://cyclewave.hom...tockcycles.html
February 22, 2011
chart: http://cyclewave.hom....com/201843.GIF
The 4-year cycle (chart, above), more ideally, will hold up into the Summer of 2011 or later. The next low for this component is due in the Autumn of 2012 or the Spring of 2013.
In terms of actual cyclic price targets, back in early-November of last year this cycle ended up confirming an upside target to the 1423.17 - 1591.25 SPX CASH range , which is still open at the present time

There is a possible time window in April/May juncture, a 2 * 104.7 trading day cycle from 07/01/10 Low (100*PI/3 = 104.7) may recur. So far it is hard to sort out what that implies. It is interesting to note that the King Wen’s sequence and Long multiple PI in this chart tags the two important Bradley-Siderograph turn Date 02/17 (King Wen sequence 02/18), 07/28-30 (Long multiple PI, end of July) ; The time span between this two turn date is about the length for one 104-107 trading day cycle ( Posted on: Feb 24 2011, 09:44 AM
link)

Discussion

(1) Siderograph
Feb 17 2011, 10:44 AM link
Bradley Siderograph - the certainty of its own existence came from “When it nailed a turn, it worked again”.
By reviewing the way it constructs the Siderograph, In a rough sense, the Bradley Siderograph can be viewed as a cumulative planetary Advance & Decline value.
------------------------
Constructing The Siderograph
http://gamma.dhs.org...es/bradley.html
- All squares (90° and 270°) and all oppositions (180°) are all considered negative.
- All sextiles (60° and 300°) and all trines (120° and 240°) are considered positive.
- Conjunctions [see table in http://gamma.dhs.org...es/bradley.html )
- the combined angle of declinations of the planets Mars and Venus.
-------------------------
Since the planetary trajectories can be calculated in advance that gives the Bradley Siderograph prediction power. According to this web site: “ Bradley's value is in determining the overall trend, and .. .. intermediate to long-term rather than short-term”.
Regardless the successful capture rate, Siderograph prediction shall be confirmed by other TA indicators. One comes to my mind is the weekly cumulative Advance and Decline Line ( such as http://stockcharts.com/freecharts/gallery.html?$NYAD ).

(2) 13 week cycle

Mar 5 2011, 09:39 AM link

13 week cycle ties with Fibonacci numbers in trading days.
0, 1, 1, 2, 3, 5, 8, 13, 21, 34, 55, 89, 144, 233, 377, 610, 987, 1597 (Fibonacci numbers http://oeis.org/A000045 )

Each years has an averaged 251 trading days, 52 weeks.

377 = 1.50 * 251 [ 18 month cycle, 377 trading days ]
377 = 251 * ( 13/52) * 6 ( 6 13-week-cycle )

( a ) 13 week cycle is only one of the cycles.
( b ) an apparent Peak/Trough is the lump-sum for all cycles together, the weight for a particular cycle is not realized
( c ) drifts in recurrence, dampens out after unknown persistence period, recurs in a spontaneous way.
( d ) Harmonics interference.

Market Cycles - http://www.decisionp...se/Cycles1.html
18 month cycle in chart: http://www.decisionp...IdealCycles.GIF

#49 stanley

stanley

    Member

  • Traders-Talk User
  • 167 posts

Posted 18 March 2011 - 12:43 AM

This is a brief update for prior post (Link) (Post #48)

Link to the very first post for Crafting the rhythms series II 12/25/2010 (Post #42)

Archives
-------------------------------------------
Feb 24 2011, 10:44 AM
link
The overall view did not change.
that is:
This downward move may hit 1229-1214. When index, indeed, hits 1214, will review the possibility to see 1175 or even lower numbers; The immediate resistance is 1317, also a pivot to nullify near term bearish call, supports are 1272-1277, 1252.
King Wen's sequence suggested a High on 02/18 or 03/04, Low on 03/02 or 03/15. Since High & Low is mutual exclusive, one confirmation voids the opposite one intuitively.

Mar 16 2011, 09:45 AM
link
Posted Image
--------------------------------------------

[A] Timing
Projection High on 02/18 confirmed by http://stockcharts.com/freecharts/gallery.html?$NYAD
Projection Low on 03/15 (-03/22) or 03/28 (03/21-04/04)

[B] Levels
Immediate resistance 1282 - 1285, 1294 (1293 = [0.786|1310:1229] ( table ) )
(1) 1282 = 1332 - (1344-1294)
(2) nearby FIB points 1286 = [0.707|1310:1229], and 1285 = [0.382|1344:1249]
(3) It is a wave overlap when Index climbs above 1294.05

Note: Intraday low on 03/16 was 1249.05
The nearby FIB points are:
1248 = [0.236|1310:1229] ( table )
1252 = [0.382|1381:1173] ( table )
1251 down wave 1.618 of length 50 from 1332
Posted Image

This chart: http://www.robertew....dley/br2011.jpg
indicates the Bradley Siderograp middle term output (definition can be found in This link (Constructing The Siderograph)

#50 stanley

stanley

    Member

  • Traders-Talk User
  • 167 posts

Posted 29 March 2011 - 12:52 PM

Crafting the rhythms series II – 03/29/11

review:
----------------------------------------------------------------
Mar 13 2011, 08:48 PM
link
Crafting the rhythms series II – 03/12/11

index moved as expected but with much slower downward pace

Zigzags cursory view
The center line is 1309 (1310), upper rail 1381, and lower rail 1228(1229).

King Wen's sequence (81,126,63,108,90,99,54,117,72)
For High
02/18/11 72TD 1344.07 confirmed, secondary high

For Low
11/16/10 96TD 1173.00
03/15/11 81TD actual 03/16 1249.05 (wait till 04/08)

Mar 17 2011, 09:43 PM
link

Intraday low on 03/16 was 1249.05
The nearby FIB points are:
1248 = [0.236|1310:1229]
1252 = [0.382|1381:1173]
1251 down wave 1.618 of length 50 from 1332

Posted on: Mar 25 2011, 09:52 AM
link (in Indexcalls.com)
Index is testing the upper resistance 1316-1324.
The unrealized high target are 1358, 1381, the unrealized low target are 1240-1229, 1214-1222

-----------------------------------------------------------------------

summary:

The secondary high observed on 02/18 (1344.07) has been confirmed.
The odd is increasing that the low observed on 03/16 (1249.05) will be a near term secondary trough; A confirmation could be made before 04/08.

Market is waiting a few key questions to be answered: (1) debt ceiling, (2) QE3, (3) The economy strength status.. etc., (a.)(b.); Before clear answers come out, market may just swing up/down with the center line at 1310; The unrealized high target are 1358, 1381, the unrealized low target are 1240-1229, 1214-1222

Near term critical resistance 1324, critical support 1305-1307
Mar 29 2011, 09:52 AM 09:26 AM
Posted Image


(a.) The 'Industrial production and capacity utilization' report released by FED says the Industrial production declined 0.1 percent in February after having risen 0.3 percent in January.

Release Date: March 17, 2011
http://www.federalre...es/g17/current/
Posted Image

(b.) Ben’s shenanigans - Fed catapult 4 probes, may be more on the way

[1] Fed's Fisher warns about excess liquidity
Fri Mar 25, 2011 10:49am EDT link
[Richard Fisher : Dallas Federal Reserve Bank President]

[2] Plosser: Fed must tighten in not-too-distant future
Fri Mar 25, 2011 9:44pm EDT link
[Charles Plosser : Philadelphia Federal Reserve Bank President]

[3] Fed's Lockhart sees "high bar" for QE3
FT. MYERS, Florida, March 25 | Fri Mar 25, 2011 11:05am EDT link
[Dennis Lockhart: Atlanta Federal Reserve Bank President]

[4] Fed Should Weigh Curtailing $600 Billion in Bond Purchases, Bullard Says
By Scott Hamilton - Mar 27, 2011 9:01 PM PT link
[James Bullard: St. Louis Federal Reserve Bank President]