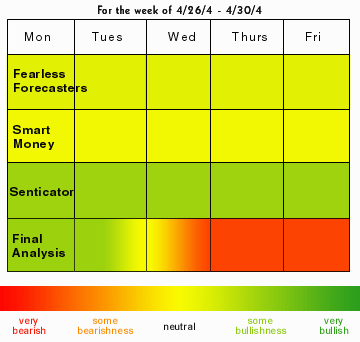
Results of the Fearless Forecaster Sentiment Poll taken after the close on 4/13/04:
Response was to this question: "At the end of next week will the S & P 500 close up (bull), down (bear), or unchanged/no opinion (neutral)?"
Weekly BULLS: 36%
Weekly BEARS: 32%
Our `Smart Money' Poll was equally Bullish as Bearish and twice as Neutral as either.
The Senticator is mildly Bullish.

Last week, I said that I was going predict predicting a rally on Monday and possibly Tuesday, but thereafter, I expected the market to fade. I said that if the market was down hard on Monday and Tuesday, we ought to look for a reversal up late in the week to give the Senticator it's rally. OK, that appears to say that if we were down early in the week, we'd get a rally late. Instead of playing it that way, I played it for lower prices still in the Subjective model. I'm going to give my call a C (my alternate was accurate, but my primary prediction was wrong, and I don't want to talk about the subjective model).
The Senticator was bullish, so the Mechanical Model went long and took a modest 0.71% Profit. I smelled some weakness coming, however, so my subjective approach took only a 1/2 short position and then when the market broke down, we went flat and took a -0.59% loss. I suppose that I should pay attention mostly to the Senticator and ignore the market action.
The Fearless Forecasters are evenly split with a tiny bit of a Bullish bias and a solid neutral contingent. Just like last week. The Smart Money is evenly split. The Senticator is Bullish, but not strongly so. We know we're again we're likely to get some sort of a rally next week, but again, I'm not that sanguine about the market's prospects. Seems like the FF's might be predicting another top. They are not alone.
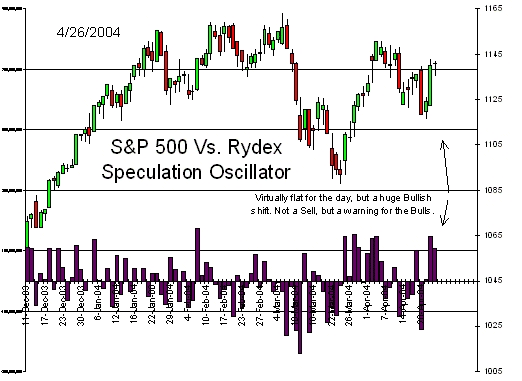
Rydex asset flows showed a large $32MM shift into of the Dynamic Bull funds and a large $43MM out of the Dynamic Bear funds. This was mostly related to the decent Nasdaq rally, but there was still ongoing capitulation in the S&P Bear funds. The RSO shows another very large shift to Bullishness, after yesterday's unsurprising shift. Overall, the RSO shows a lot of acceptance of the rally, even on a sloppy day. I think that is worrisome.

Last week, AAII reported 50% Bulls down from 64% and 23% Bears up from 14%. That's a steep drop. Investors Intelligence reported 49.5% Bulls down from 50% Bulls and 21.2% Bears up slightly from 20% Bears. Nothing showing any pessimism. Low Risk reported 22% Bulls down from 35% Bulls and 37% Bears, up from 33% Bears. We'll be eagerly awaiting this weeks numbers.
Message board sentiment shows 49% Bulls, and 29% Bears. That's a lot of Bulls, but nothing outlandish. The actual position poll posted on Friday evening, came away with 61% at least partially long, and 19% short or partially short. The outlook for the week isn't as bullish, with 51% with a generally Bullish bias, but what's disturbing is that only 9% say they are fully Bearishly positioned for the week. That strikes me as a veritable invitation for a decline.
The equity P/C ratio rose a tad to 0.63, which is probably reasonable due to the weekend risk. The VIX, however, hit a multi-year low on Friday (higher than any time since 1995). That's a major warning light. It appears that no one is willing to pay much for puts.
The Senticator is Bullish, so we know that there is likely to be some sort of tradable rally next week. The big problem is that the Fearless Forecasters are again evenly split and so is the Smart Money. The message board poll and the VIX also suggest the possibility of a sharp decline. This might not be as tricky as last week, but I'm not sure I can count on that. I really don't like how few Bears there are, and the VIX is basically saying that no one is interested in hedging or is afraid of a nasty surprise. I think that I need to try to play it as simply as possible and then try to adjust if things change during the week. The Senticator is Bullish, so look for higher prices early. Look for a top by Wednesday as per evenly split Fearless Forecasters, and then look for substantial selling into Friday. If things change, we'll advise in the ISA Navigator.
The Mechanical Senticator Trading model will go long a full position (limit 114.5). My subjective approach will take a 1/2 long position at the open (limit 114.5, good for the day). If we trade down hard early in the week, we'll double up. If we get filled at the open and the market rallies to 116.10, my subjective approach will sell.
**********************************************************
Details of the Senticator Trading Model are below. This is mechanical only, but the mechanical version looks like it works pretty well. See below for the trading rules.
SPY Trading Model
A simple model for trading the SPY (note, this is based upon a simple, easy to apply--and thus implement-- back-test).
You can easily implement this trading style with one phone call to your broker before the open, and occasionally, one call at the close on Wednesday. It's IDEAL for those who want to trade and exploit the Senticator's incredible accuracy, and also for those who don't have time to watch the market all day.
- Rule #1: Buy or Sell (based upon the Senticator signal) at the open on Monday.
- Rule #2: Enter an order to exit the position at a 2% profit.
- Rule #3: Enter a Stop Loss order at a 3% loss.
- Rule #4: If stopped, Re-enter on Wednesday at the close if SPY position is still off 2% or more at the close (i.e. on a Senticator Sell, if stopped, if the SPY is up 2% from Monday's open on Wednesday's close, re-enter).
- Rule #5: If the market gaps open 1% or more in the direction of the signal, pass on the trade.
The results of this trading model were quite respectable, considering the limitations of end of day trading. The implied net return was over 60% for the past two years, with a 6:4 win/loss ratio. - Rule #6: Win, lose, or draw, exit at the close on Friday, if you have not already done so.
09/10/01 3.61%
10/26/01 -3.61%
11/30/01 11.33%
12/31/01 7.47%
01/28/02 5.51%
02/25/02 1.18%
03/25/02 -0.54%
04/29/02 -9.45%
05/28/02 0.71%
06/24/02 -11.88%
07/29/02 2.57%
08/26/02 4.48%
09/09/02 -3.53%
10/28/02 5.12%
11/25/02 11.63%
12/30/02 1.47%
01/27/03 -4.48%
02/24/03 -2.58%
03/31/03 6.53%
04/28/03 0.99%
05/27/03 0.97%
06/30/03 14.40%
07/28/03 0.41%
08/25/03 4.53%
09/29/03 3.52%
10/31/03 5.29%
10/27/03 5.29%
11/24/03 -1.64%
12/29/03 1.09%
1/31/04 1.03%
Cumulative Implied Net Return on Margin 68.4%.
All results are hypothetical, and do not represent an actual account. We assumed 81% leverage and $14 commissions trading the SPY. We did not account for interest received nor interest expenses nor dividends. Obviously, past performance is no indication of future returns.
For more on using the ISA and the various sentiment poll data, click here:
Mark Young
Editor

Subscriptions to Institutional Sentiment and Analysis are $99 per year. This also includes special sentiment updates and reports. Our polls are unique and insightful, and our analysis is some of the most accurate on the Street.
See the link below for a historical chart of Fearless Forecaster sentiment.
ABOUT SENTIMENT AND ANALYSIS
The Fearless Forecaster Sentiment Poll is taken each Friday from a generally static pool of experienced technical analysts (both private and professional). The Fearless Forecaster Sentiment is not normally a good fade, though there are times when it can be.
The Fearless Forecaster sentiment data is useful on the short term; the Fearless Forecasters tend to be right. Typically they are right sooner rather than later, if there's a large plurality. On the flip side of the equation, if 90% or more are Bullish or Bearish, the odds of them being right over the very short term are huge, but the odds of a major turn (in the opposite direction) soon thereafter are also quite good.
We have also found that when the Fearless Forecasters are evenly split, look for a BIG move in either direction, but usually down.
Over the years, we have found a number of other tools to help in evaluating the Fearless Forecaster Sentiment. We publish this in our weekly "Institutional Sentiment & Analysis" (a part of our institutional research). These additional tools are our "Smart Money" poll, and our Senticator. Both are proprietary polls run by us.
We have found that the Senticator tends to be right by the end of the week (as much as 82.7% of the time), though it tends to be more accurate in a rising market than a falling one.
The "Smart Money" pollees are very useful when there is divergent opinion. It's generally NOT a good idea to fade the "Smart Money" unless "'EVERYONE'" (all sentiment measures) is in agreement. When in doubt about the meaning of the Fearless Forecaster Sentiment Poll, defer to the "Smart Money" poll. The "Smart Money" guys are folks with whom I've worked or whom I've watched for YEARS. They all have different approaches and they're all VERY good (not infallible, just good analysts/traders).
Subscriptions to Institutional Sentiment and Analysis are $99 per year. This also includes special sentiment updates and reports. Our polls are unique and insightful, and our analysis is some of the most accurate on the Street.
Order today by calling 1-800-769-6980 or order on-line at
http://www.equitygua.../sentiment.html
http://www.equitygua...oup.com/isa.htm


