

IN CYCLES WE TRUST
Started by
voltaire
, May 16 2010 05:50 AM
42 replies to this topic
#12

fib_1618
-

- Traders-Talk User
- 10,145 posts
Member
Posted 16 May 2010 - 09:23 AM
Just for the sake of clarity....although the nominal price highs did come on April 15th 2010, the orthodox internal highs of the Aussie Market came October 21, 2009. This high point, and the beginning of their bear market, was later confirmed on November 19th when liquidity levels dried up completely because of monetary policy by the Reserve Bank of Australia. On the other hand, US monetary policy remains quite aggressive in this area of analysis, so we should see higher price highs in the SPX before all is said and done...each marketplace should be traded accordingly.The Aussie market which I trade...made its high on April 15th.
Fib
Better to ignore me than abhor me.
“Wise men don't need advice. Fools won't take it” - Benjamin Franklin
"Beware of false knowledge; it is more dangerous than ignorance" - George Bernard Shaw
Demagogue: A leader who makes use of popular prejudices, false claims and promises in order to gain power.
Technical Watch Subscriptions
#13
selecto
-

- Traders-Talk User
- 6,871 posts
Member
Posted 16 May 2010 - 09:48 AM
Fib, what do you watch to gauge "liquidity" available for the markets? TIA
Edited by selecto, 16 May 2010 - 09:49 AM.
#14
pisces
-

- Traders-Talk User
- 1,179 posts
Member
Posted 16 May 2010 - 10:51 AM
Just for the sake of clarity....although the nominal price highs did come on April 15th 2010, the orthodox internal highs of the Aussie Market came October 21, 2009. This high point, and the beginning of their bear market, was later confirmed on November 19th when liquidity levels dried up completely because of monetary policy by the Reserve Bank of Australia. On the other hand, US monetary policy remains quite aggressive in this area of analysis, so we should see higher price highs in the SPX before all is said and done...each marketplace should be traded accordingly.The Aussie market which I trade...made its high on April 15th.
Fib
fib, any high or low in any market is a pricepoint,how any orthodox internals add any clarity is beyond me.
pisces.
#15
dadook
-

- Traders-Talk User
- 320 posts
Member
Posted 16 May 2010 - 11:30 AM
Just for the sake of clarity....although the nominal price highs did come on April 15th 2010, the orthodox internal highs of the Aussie Market came October 21, 2009. This high point, and the beginning of their bear market, was later confirmed on November 19th when liquidity levels dried up completely because of monetary policy by the Reserve Bank of Australia. On the other hand, US monetary policy remains quite aggressive in this area of analysis, so we should see higher price highs in the SPX before all is said and done...each marketplace should be traded accordingly.The Aussie market which I trade...made its high on April 15th.
Fib
Hi Fib,
I see what you are saying (or correct me), that internals and price highs were made together in US so expect next for prices to make higher highs while internals don't, which will give the clue for a top. This sounds very reasonable, but is it absolute? What if the context this situation is in is really different this time.
Thx
d
#16
selecto
-
- Traders-Talk User
- 6,871 posts
Member
Posted 16 May 2010 - 11:42 AM
Are not monthly and weekly $NYSI and $NYAD divergent from price? What is to be made of that?
#17
milbank
-

- TT Patron+
- 4,714 posts
Member
Posted 16 May 2010 - 12:00 PM
So you are saying that we are just now starting the 30's drop
and what happened from 07-09(50% drop) was just rumblings ?
Another 50% from April puts us at 600 S&P.
Sounds good to me.
I expect we have years to go to complete this bear and am looking for July 5th 2013.
I think that may be a fine date for Australia but I think the US will have to suffer even longer.
There is no way this can end well IMO, and that is a technical view without regard to any fundamental analysis which IMO is even more pessimistic.
I'm no expert on cycles, I rely on you folks to show me those but, I have expected the trajectory of this bear to move very similarly to the the early '30s trajectory with the second half, to take more of a route similar to the Japanese drop to their bottom. Nonetheless, just as in the '30s where currency issues were the chief technical issue, it will be in this second phase of the bear. I could see from the beginning of this, while the specifics would be different, the generalities would be the same and, no matter what was done this time, the results would ultimately be the same. You can't have the kind of debt destruction the ibanks wrought upon the western economies without a similar result to the '30s. I too have expected, as I have said for a few years now, 2013 to be the area of the ultimate bottom with a cyclical bull like what we have just had. Just like we have just had. Everything seems to be running on schedule.
I've often used this chart from dshort.com here in the past for the visual example . It still holds up, and I expect it will continue to hold up, as a general "road map" to past and future movement. The "history rhymes" view. . . .

Edited by milbank, 16 May 2010 - 12:03 PM.
"The power of accurate observation is commonly called cynicism by those who have not got it."
--George Bernard Shaw
"None are so hopelessly enslaved as those who falsely believe they are free."
--Johann Wolfgang von Goethe
#18
Lee48
-

- Traders-Talk User
- 1,619 posts
Member
Posted 16 May 2010 - 12:30 PM
Cast in Stone? I'd say that's pretty bold talk for a one eyed fatman...just kidding, I thought this was interesting.... 
The dominant cycle is the 5 year bear cycle from the 2007 high. This weekly chart roughly shows the next 2.5 years. The index has started a large sideways movement that will be distribution for a bear trend and that trend will last 1.5 to 2 years and end either September 3, 2012 or November 28, 2012. Those two dates are cast in stone. The date the movement "on the side" ends and the downtrend begins is not yet clear nor is the extent of the decline but this is a high confidence forecast. The index will start down from a break to new highs and that price could be 1247 as I previously explained. The index should test the highs and lows to the sideways pattern 2 or 3 times.
http://www.safehaven...x-europe-report
#19
fib_1618
-
- Traders-Talk User
- 10,145 posts
Member
Posted 16 May 2010 - 12:48 PM
The only liquidity gauge that has a direct investment effect (reflection) on stock prices is the advance/decline line of that specific market.Fib, what do you watch to gauge "liquidity" available for the markets?
Since we deal with weighted component averages that are created to reflect intrinsic value, the collective direction of a majority group of stocks that make up the total available in which to buy and sell is the sole definition of a bull or bear market of one degree or the other.any high or low in any market is a price point, how any orthodox internals add any clarity is beyond me.
Given that we're dealing with emotional animals and their frailties, nothing in life can be said to be absolute. However, in the 74 years that this area of data analysis has been kept, there has never been a time where we've had a price top with the majority of stocks moving in this same direction.This sounds very reasonable, but is it absolute?
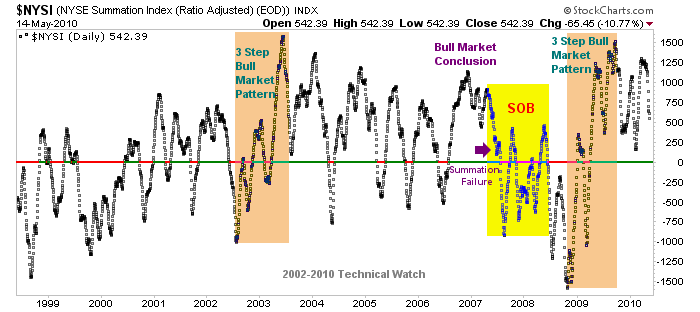
A lessening of momentum is always to be expected once an extreme point in acceleration is generated. In this case, the NYSI only measures the intermediate term TREND of the NYAD line. Given that this same momentum peak in the trend of the A/D line was just produced in September of 2009, we should look for a (historical) series of more than 4 divergent points below this peak before this same uptrend will be called complete. A great example of what should occur happened earlier in this decade for the NYSI where we saw the peak in 2003 and subsequent peaks generated through 2006 that led to the final hurrah in 2007 (see chart below).Are not monthly and weekly $NYSI and $NYAD divergent from price?
If we're going to use technical analysis to help us gain an advantage in attaining wealth, it's extremely important that we're not swayed by economical or political distractions that can cause an emotional response. To do otherwise defeats the purpose of why we do this in the first place. At the current time, the Aussie market can be confirmed as being in a bear market in the same way that the US markets continue to support of being in one of a longer term uptrend. The main component that allows these two opinions is aggregate direction in the flow of money (or lack there of) as generated by the advance/decline of these respected marketplaces. So until this configuration changes, any global induced declines in stock values will show better emphasis with Australian stocks than those on the NYSE. This also means that these same stocks "down under" will lack the amplitude (both in breadth and scope) of any reflexes higher from impending bottoms that lie in the future. Because of this, and until proven otherwise, it would be in the best interest of traders to treat each marketplace according to this degree of probability to outcome. This money flow component also includes cycle work which only compliments this same component factor, and from where, can allow price patterns to either have declines that have capitulation type structures to them, or have prices that move up and away from consolidation periods that are generated by these same cyclical nesting periods.
Fib
Edited by fib_1618, 16 May 2010 - 12:55 PM.
Better to ignore me than abhor me.
“Wise men don't need advice. Fools won't take it” - Benjamin Franklin
"Beware of false knowledge; it is more dangerous than ignorance" - George Bernard Shaw
Demagogue: A leader who makes use of popular prejudices, false claims and promises in order to gain power.
Technical Watch Subscriptions
#20
Not Too Swift
-

- Traders-Talk User
- 2,089 posts
Member
Posted 16 May 2010 - 02:57 PM
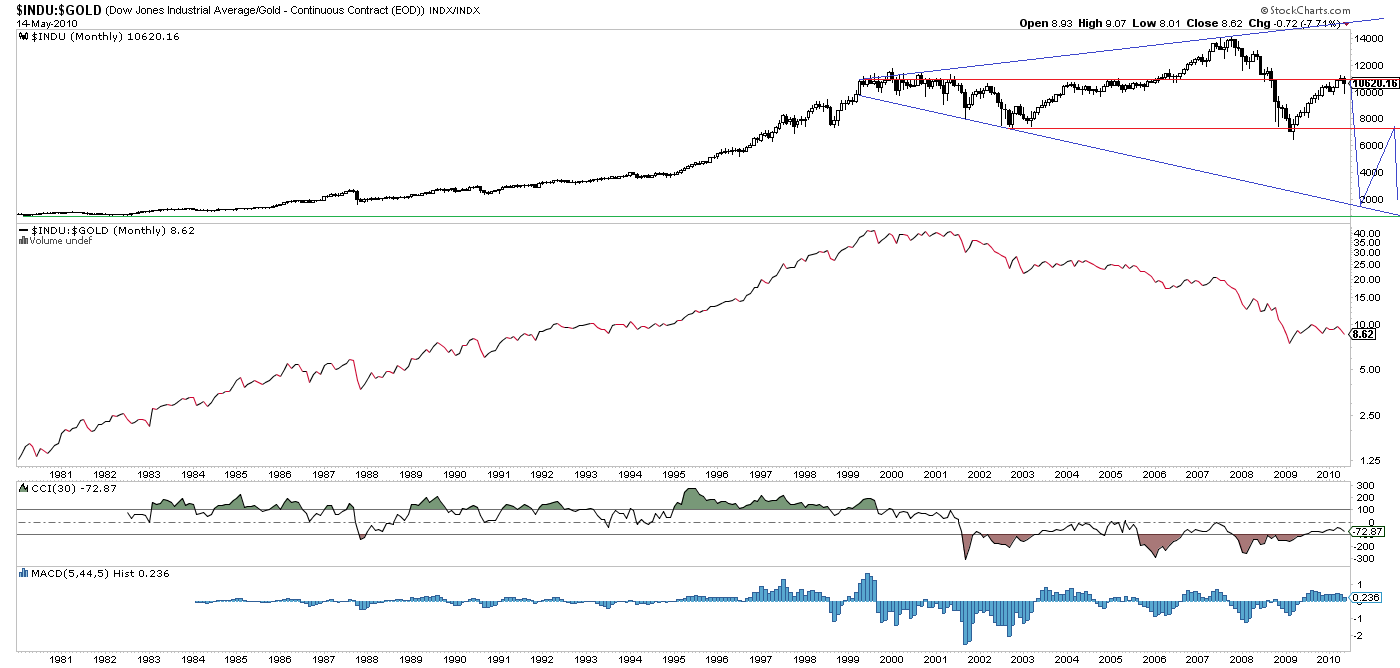
The liquidity difference just comes out as inflation.
If you adjust the plots for inflation you get a different story.
See this dshort plot:
http://dshort.com/ch...r-2000-extended
You can be long in a seemingly bull market and still lose value.
If you adjust the plots for inflation you get a different story.
See this dshort plot:
http://dshort.com/ch...r-2000-extended
You can be long in a seemingly bull market and still lose value.
Edited by Not Too Swift, 16 May 2010 - 02:58 PM.
I let the market tell me what to do. The trouble is she mumbles a lot, and I'm hard of hearing.
1576 ONO. Upside down, reverse, inside out, snort...
1576 ONO. Upside down, reverse, inside out, snort...


