Jump to content


Photo

Was it the Fib or the Fork?


  • Please log in to reply
39 replies to this topic

#21 zoropb

zoropb

    Member

  • Traders-Talk User
  • 8,392 posts

Posted 16 August 2010 - 10:18 PM

I should say I am long for that wee bounce (FAS). If wee turns into whee, I'll ride it with glee. But if the lower tine gives way, I'll have to say, time to cash in for another day...

http://stockcharts.c...6263&r=6082.png

Enjoy it indeed, as I agree, tomorrow is a moment of glee! But for those who are late, the number 958 is likely the next number to be. :D

Love, be kind to one another, seek the truth, walk the narrow path between the ying and the yang.


#22 colion

colion

    Member

  • Traders-Talk User
  • 1,169 posts

Posted 16 August 2010 - 10:31 PM

My pitchfork has the same anchors and yet today's action is well below the median line. Any clue as to what the difference is?


Scale. Mine is LOG scale.
However the FIB scale produced the same result as the LOG scale!


My chart is also log scale. The Fib value is not affected by use of log or linear scaling. I'll check the chart on a couple of more programs and see what happens.

#23 arbman

arbman

    Quant

  • Traders-Talk User
  • 19,504 posts

Posted 16 August 2010 - 10:41 PM

D, Feb 2009 sell was too after a liquidity driven disappointment, if you remember. The banks got what they wanted after some 200 points slide at that time. I am thinking this time 100-150 will be enough to get the Fed motivated and the rest of the govt forces jumping out of the windows in panic --around Octoberish. I do not think Fed can remain stubborn for too long, there is your slippery slope of hope...

#24 totterdell91

totterdell91

    Member

  • Traders-Talk User
  • 494 posts

Posted 17 August 2010 - 02:55 AM

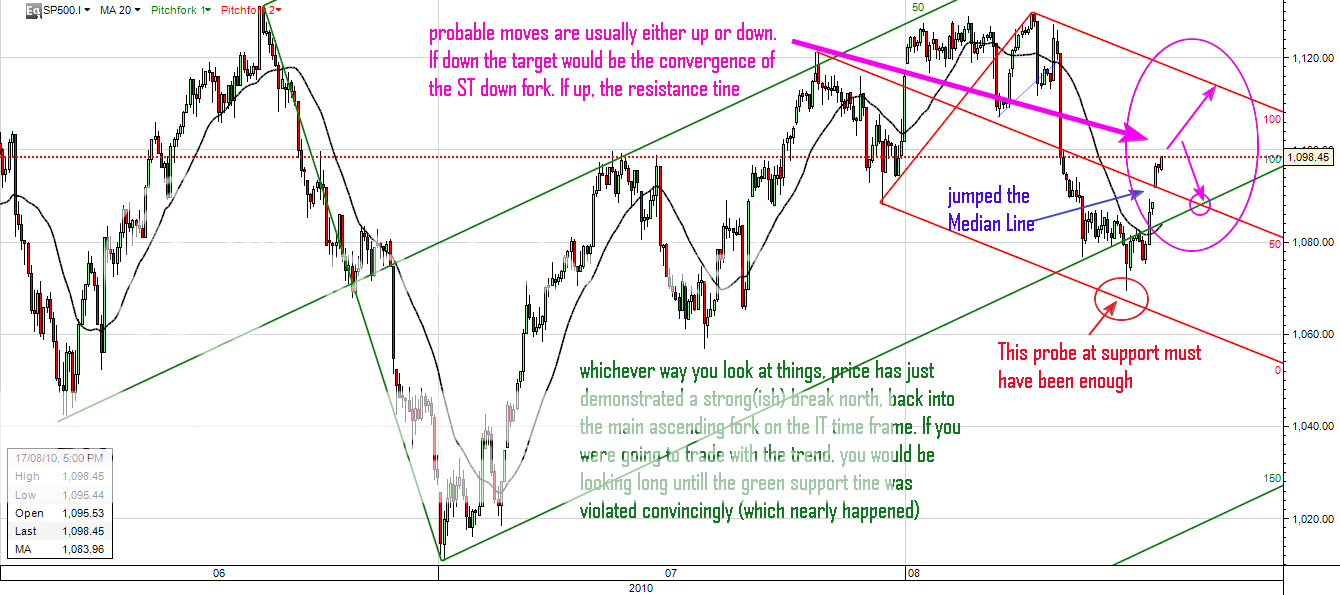
I have some time left after checking my email, so I ran up this SPX 60 min chart.

The point of the chart is how I read a pitchfork chart, as distinct from how I draw one, given that I have analysed quite a few thousand over the years. The on-chart notes are pointers to the simple patterns I look for to assist me in reading the chart, and which give me confidence that I have drawn it correctly.

Some declarations are
I always use linear scale
I always use price extremes, not close or open
I do use additional lines such as warning lines and internal divisions
I do use Schiff and modified schiff alignments where justified (but with restraint)
I do use action/reaction lines, pivot point boxes and some other stuff, but for the moment I will stick to the basics

I am not trying to convert anyone. I am simply making the point that having analysed a lot of these charts, I do have a set of rules which I use for drawing, and I do use them in my trading. In fact I trade soley from andrews methods, and I trade every global index I can think of, and a lot of individual equities and commodities

http://i674.photobuc...08-17173224.png

#25 Rogerdodger

Rogerdodger

    Member

  • TT Member*
  • 26,873 posts

Posted 17 August 2010 - 10:17 AM

MTGP Question:
I drew in another fork in GREY.
Do you think it has any validity?
I also stuck in a s/t FIB scale.

Was it the Fib or the Fork which found support at 1070ish?


http://stockcharts.com/c-sc/sc?s=$SPX&p=D&yr=0&mn=7&dy=0&i=p56110117106&a=206391668&r=2753.png

And how about that Hindenberg volume? :o


Edited by Rogerdodger, 17 August 2010 - 10:21 AM.


#26 Mr Dev

Mr Dev

    Member

  • Traders-Talk User
  • 11,528 posts

Posted 17 August 2010 - 10:37 AM

stop the forking madness :lol:

.. .. ..
Mr Dev

......trading is basically a simple operation, but you have to be a genius to understand the simplicity.
.....timing,..... is ....everything !
... remember no guessing visit MrDev!

#27 zoropb

zoropb

    Member

  • Traders-Talk User
  • 8,392 posts

Posted 17 August 2010 - 11:15 AM

RD a nice Fiborking around 12.58 pm. Perhaps 1098.88 (had to through the 8's in sounds kinda salesish) :D

Edited by zoropb, 17 August 2010 - 11:17 AM.

Love, be kind to one another, seek the truth, walk the narrow path between the ying and the yang.


#28 IYB

IYB

    Member

  • TT Patron+
  • 7,145 posts

Posted 17 August 2010 - 12:31 PM

RD a nice Fiborking around 12.58 pm. Perhaps 1098.88 (had to through the 8's in sounds kinda salesish) :D

Okay, we're there. Can we stick a Fibork in it now? :huh:
“Men, it has been well said, think in herds; it will be seen that they go mad in herds, while they only recover their senses slowly, one by one.” Charles Mackay, Extraordinary Popular Delusions and the Madness of Crowds

#29 zoropb

zoropb

    Member

  • Traders-Talk User
  • 8,392 posts

Posted 17 August 2010 - 12:42 PM

RD a nice Fiborking around 12.58 pm. Perhaps 1098.88 (had to through the 8's in sounds kinda salesish) :D

Okay, we're there. Can we stick a Fibork in it now? :huh:

Just shorted posted live on my blog. Short 1098.50 es will dump a third at 1096 =cash.

Edited by zoropb, 17 August 2010 - 12:43 PM.

Love, be kind to one another, seek the truth, walk the narrow path between the ying and the yang.


#30 totterdell91

totterdell91

    Member

  • Traders-Talk User
  • 494 posts

Posted 17 August 2010 - 12:49 PM

A little more, just to show how things are panning out.

The important bit, just in case it is lost on anyone, is that although I got the next move wrong, I had a chart to tell me when I went wrong, and it allowed me to re-interpret the situation so the damage is not too great, and a bloke could actually change tactic to make a small profit (assuming he head a decent stop loss strategy, of course)
http://i674.photobuc...08-18033226.png