iloli, I proved it to myself every rollover, lol. You can prove it to yourself for at least the last rollover. Just toss up SPX and zone in on the close 6/10 and the open 6/12 and compare the prices on that free service to say other services for the June and Sept contracts and you will see for yourself. Also pay attention at the next roll in Sept.
Best,
Doc

The Fed Event
Started by
TechMan
, Jun 22 2011 10:45 AM
39 replies to this topic
#32

Echo
-

- Traders-Talk User
- 2,273 posts
Member
Posted 22 June 2011 - 09:25 PM
Hi D & Z, Thanks for the updates. 65-76% down is good enough to have an edge with proper stops. Looking at the futures, you are already right. Now lets see what the night brings (euro PMIs on tap) and the morning claims then new homes at 10am. Im sure the economic numbers will be just rosey don't you?
Doc
#33
zoropb
-

- Traders-Talk User
- 8,392 posts
Member
Posted 22 June 2011 - 09:48 PM
Yep "fantastic" in more ways than one.Hi D & Z, Thanks for the updates. 65-76% down is good enough to have an edge with proper stops. Looking at the futures, you are already right. Now lets see what the night brings (euro PMIs on tap) and the morning claims then new homes at 10am. Im sure the economic numbers will be just rosey don't you?
Doc
Love, be kind to one another, seek the truth, walk the narrow path between the ying and the yang.
#34
iloli way
-

- TT Member*
-

- 4,028 posts
iloli = I'm Laws Of Line's I(eye)
Posted 22 June 2011 - 09:51 PM
iloli, I proved it to myself every rollover, lol. You can prove it to yourself for at least the last rollover. Just toss up SPX and zone in on the close 6/10 and the open 6/12 and compare the prices on that free service to say other services for the June and Sept contracts and you will see for yourself. Also pay attention at the next roll in Sept.
Best,
Doc
Doc,
, does not equal to "there have been 3 rollovers each dropping the bars by 4-5 point, or now by 12-15 points.", does it?...for at least the last rollover.
Weren't the two before last 'contangos'? only the last one 'backwardation'? I'm ignorant sometimes, so I can't rule out making myself a fool here.
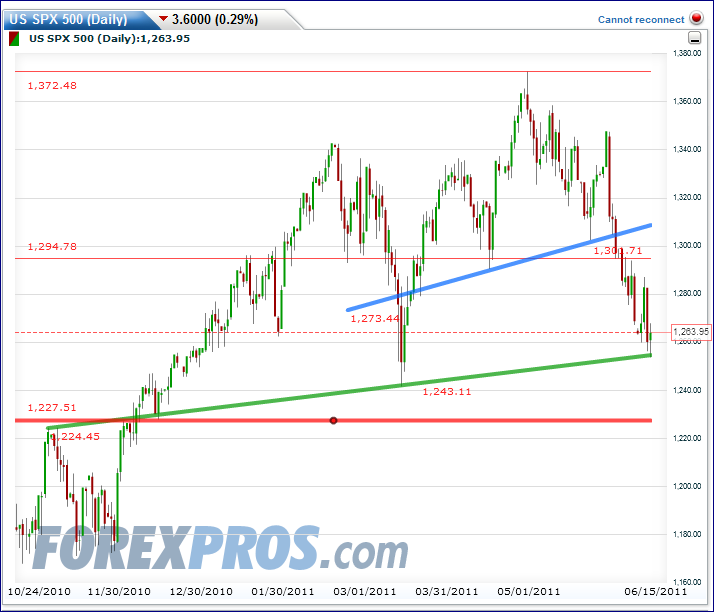
All and all, I don't think this affect the accuracy of that LINE. Go below it (green line here) we will meet the Red line. (this chart was taken last Friday also)
PRICE IS KING; LINE RULES! - Laws Of Line (LOL) Trading Systems
Swing Those Lines: I can calculate the motion of heavenly bodies, but not the madness of people! -- Issac Newton
Swing Those Lines: I can calculate the motion of heavenly bodies, but not the madness of people! -- Issac Newton
#35
SemiBizz
-

- Traders-Talk User
- 23,208 posts
Volume Dynamics Specialist
Posted 22 June 2011 - 10:49 PM
Looks like we're shifting from the dominant 3 year cycle resistance on the SPX and joining the Nasdaq in the 10 yr cycle resistance.... generating an upside resistance now in this new range of 1316, with a downside objective of 1081.
http://bigcharts.mar...&mocktick=1.gif
http://bigcharts.mar...&mocktick=1.gif
Z - BTW, you're the numbers guy. Do you have any thought on that 1267 number?
6-13 low = 1265
6-15 close = 1265
6-16 open = 1265; close = 1267
6-17 low = 1267
6-20 low = 1267
Price and Volume Forensics Specialist
Richard Wyckoff - "Whenever you find hope or fear warping judgment, close out your position"
Volume is the only vote that matters... the ultimate sentiment poll.
http://twitter.com/VolumeDynamics http://parler.com/Volumedynamics
Richard Wyckoff - "Whenever you find hope or fear warping judgment, close out your position"
Volume is the only vote that matters... the ultimate sentiment poll.
http://twitter.com/VolumeDynamics http://parler.com/Volumedynamics
#36
SemiBizz
-
- Traders-Talk User
- 23,208 posts
Volume Dynamics Specialist
Posted 22 June 2011 - 10:58 PM
Here's the dominant 3 year cycle support and resistance for the SPX...
Bear Stearns Crisis March 2008
1257-1360
http://bigcharts.mar...&mocktick=1.gif
For 2011
1249-1370
All this was laid out in my 2/6/11 Monthly Chart Review:
Bear Stearns Crisis March 2008
1257-1360
http://bigcharts.mar...&mocktick=1.gif
For 2011
1249-1370
All this was laid out in my 2/6/11 Monthly Chart Review:
Why is the SPX lagging?
Without giving you a fundamental answer, we can find our answer in the charts. The answer is that the SPX is limited by the events that happened in early 2008 concerning the financials and more directly the BEAR STEARNS CRISIS.
Now both of these indices have managed to climb above the primary rally objective.. one that I identified here in the Summer of 2009, that the objective of this rally would be to rebuild the September 08 breakdown. The SPX accomplished that this week with the weekly close over 1308 at 1310.
Now looking at the way the SPX broke down, we're expecting considerably more resistance at this 1300-1335 level than we have seen since the May Flash Crash and of course the March 2009 lows. Now the reason we are using the Jan-March 2008 as a guide here, is simply because that is where and when the VOLUME BENCHMARKS were established
Edited by SemiBizz, 22 June 2011 - 10:59 PM.
Price and Volume Forensics Specialist
Richard Wyckoff - "Whenever you find hope or fear warping judgment, close out your position"
Volume is the only vote that matters... the ultimate sentiment poll.
http://twitter.com/VolumeDynamics http://parler.com/Volumedynamics
Richard Wyckoff - "Whenever you find hope or fear warping judgment, close out your position"
Volume is the only vote that matters... the ultimate sentiment poll.
http://twitter.com/VolumeDynamics http://parler.com/Volumedynamics
#37
Echo
-
- Traders-Talk User
- 2,273 posts
Member
Posted 22 June 2011 - 11:01 PM
Lol, why is this so hard for you to understand. This is not oil futures that shift from contango to backwardation. This is SP futures which given the current interest rate environment, is at a discount to cash, which is about 4-5pts at rollover and erodes into expiry. This free service just shifts from one contract to the other sometime the week before expiry and the value on this cumulative chart drops those 4-5 points. On the chart you have posted, you can see the 5 point drop at the open 6/12 Sunday. Your green line is not perfectly accurate. Its not off by much. Just depends if you a horseshoes and handgranades kind of chartist. Here is the same line on spx cash. As you can see, we already dipped below your green line and we then popped above it...I'm not trying to be a wise @ss here. Just trying to help with something I have observed with this service. Take it or leave it.
http://stockcharts.com/c-sc/sc?s=$SPX&p=D&yr=0&mn=8&dy=0&i=p32109840380&a=204296642&r=988.png
Doc
http://stockcharts.com/c-sc/sc?s=$SPX&p=D&yr=0&mn=8&dy=0&i=p32109840380&a=204296642&r=988.png
Doc
#38
Echo
-
- Traders-Talk User
- 2,273 posts
Member
Posted 22 June 2011 - 11:09 PM
Semi, What a wild month that March 2008 was. You had a 20, 30, 45 and 52 point up days and still ended the month down!
#39
SemiBizz
-
- Traders-Talk User
- 23,208 posts
Volume Dynamics Specialist
Posted 22 June 2011 - 11:48 PM
Remember it well...
Ben Blinked
Bailed out Bear Stearns...
That's when the moral hazard precedent was set.
Which begs the question...
Why does this man still have this job?
Price and Volume Forensics Specialist
Richard Wyckoff - "Whenever you find hope or fear warping judgment, close out your position"
Volume is the only vote that matters... the ultimate sentiment poll.
http://twitter.com/VolumeDynamics http://parler.com/Volumedynamics
Richard Wyckoff - "Whenever you find hope or fear warping judgment, close out your position"
Volume is the only vote that matters... the ultimate sentiment poll.
http://twitter.com/VolumeDynamics http://parler.com/Volumedynamics
#40
iloli way
-
- TT Member*
-
- 4,028 posts
iloli = I'm Laws Of Line's I(eye)
Posted 23 June 2011 - 02:27 AM
Dear Doctor Echo, plz be 'patient' for a change, I did get confused for a while by you. Why dont you just show us your other non-free ES chart and point out the discrepancy btwn the two services to make your point ?! so I can take it or leave it. You know, you compare SPX to ES charts are like compare orange to apple.Lol, why is this so hard for you to understand. This is not oil futures that shift from contango to backwardation. This is SP futures which given the current interest rate environment, is at a discount to cash, which is about 4-5pts at rollover and erodes into expiry. This free service just shifts from one contract to the other sometime the week before expiry and the value on this cumulative chart drops those 4-5 points. On the chart you have posted, you can see the 5 point drop at the open 6/12 Sunday. Your green line is not perfectly accurate. Its not off by much. Just depends if you a horseshoes and handgranades kind of chartist. Here is the same line on spx cash. As you can see, we already dipped below your green line and we then popped above it...I'm not trying to be a wise @ss here. Just trying to help with something I have observed with this service. Take it or leave it.
http://stockcharts.com/c-sc/sc?s=$SPX&p=D&yr=0&mn=8&dy=0&i=p32109840380&a=204296642&r=988.png
Doc
Maybe I am a V.C. type of chartists, as long as ES free chart is consistent with itself, and I can use it to win the war, I don't mind whether General XXX graduated from West Point or not, just irrelevant.
Edited by iloli, 23 June 2011 - 02:39 AM.
PRICE IS KING; LINE RULES! - Laws Of Line (LOL) Trading Systems
Swing Those Lines: I can calculate the motion of heavenly bodies, but not the madness of people! -- Issac Newton
Swing Those Lines: I can calculate the motion of heavenly bodies, but not the madness of people! -- Issac Newton


