
by Carl Swenlin
It is not hard to find news about Apple (AAPL), but most of it involves recommendations to buy or sell AAPL based on fundamental issues. On December 14 I did a technical analysis of the AAPL chart -- Apple at Critical Support -- and I think it is time to update that analysis.
(This is an excerpt from recent blogs for Decision Point subscribers.)
<a href="http://www.decisionpoint.com/dp_freetrial3.html">Click here for FREE TRIAL!
The critical support referred to above was a line drawn across the May and November lows. In December that line of support was broken decisively with a down gap of about 50 points. There was a failed rally back toward the line, which only filled the earlier gap, but did not challenge the resistance. While the horizontal resistance may come into play sometime in the future, the more immediate issue is the declining tops line, drawn from the September all-time high.
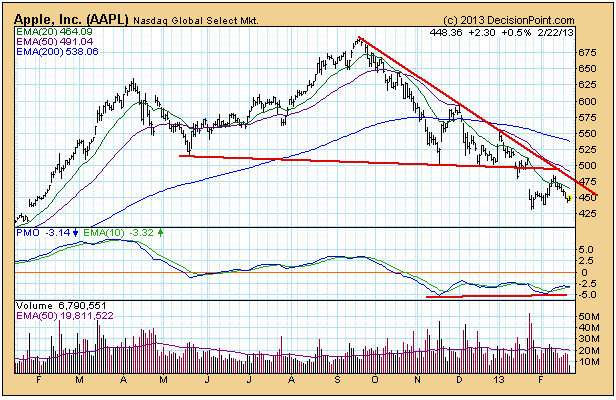
A positive feature on the chart is the PMO positive divergence (the price low in January is lower than the low in November, but the most recent PMO bottom is higher than the one in November). However, AAPL is in a bear market and in an established down trend, so we need to be more concerned with the downside potential.
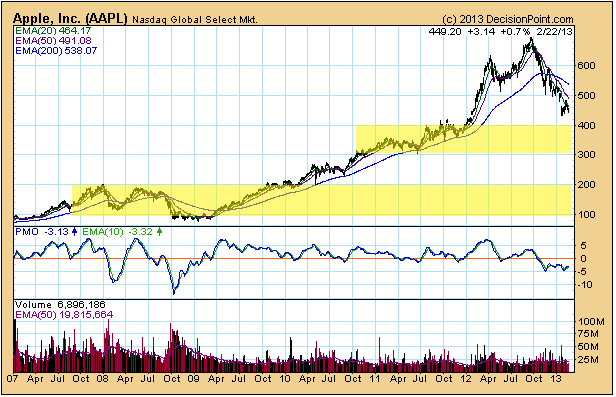
The chart below shows two possible support zones defined by areas of price congestion, but, of course, support can materialize anywhere. Another thing the chart shows us is that the PMO is not nearly as oversold as it has been historically, meaning that the potential for more downside is clearly present.
In 2007-8 AAPL experienced two declines oof about 50%, so if the current correction follows historical example, a 50% decline would take prices down to 350 -- rignt in the middle of the first support zone.
Conclusion: AAPL is in a down trend and the stock is in a bear market, so it is far from being a buy candidate. The PMO positive divergence offers thin evidence that a bottom could be forming, but any excursions on the long side should be managed on a strictly short-term basis. Currently, I think that 350 is a reasonable downside target, but I have an open mind.
* * * * * * * * * * * * * * * * * * * * *
Technical analysis is a windsock, not a crystal ball.
* * * * * * * * * * * * * * * * * * * * *
Decision Point's Timer Digest Rankings
* * * * * * * * * * * * * * * * * * * * *
BIO:[/b] Carl Swenlin is a self-taught technical analyst, who has been involved in market analysis since 1981. A pioneer in the creation of online technical resources, he is president and founder of DecisionPoint.com, a premier technical analysis website specializing in stock market timing, market indicators, charting, and focused research reports. Mr. Swenlin is a Member of the Market Technicians Association.
* * * * * * * * * * * * * * * * * * * * *
Copyright 2013 Decision Point. Nothing herein should be construed as an offer or solicitation to buy or sell any security. Past performance does not indicate future results.


