If cycles in the markets have any effect any more there should be a top of some degree in the 3/7 to 3/11/14 area, with the next CIT timing around 3/27/14 +/- a day or two (presumably a low). After that I have CIT projections pointing to 4/22/14 area, which also happens to be a major astro alignment. At the moment I'm thinking 4/22 area may be a final high or lower retest of the highs. Polarity is always difficult to guess in advance of these CIT windows, so we'll see which way the market is trending into 4/22 and look for signs of a reversal. The next important confluence of price projections in my work are in the 1890 to 1906 range basis the SPX. So it looks like we are in an area here where price and time projections are coming together once again. I've been stopped out a number of times trying to short this market, but will be shorting again on this thrust into the 1900 area.
Kimston

Are we making a generational top in stocks?
Started by
Kimston
, May 03 2013 10:23 AM
54 replies to this topic
#42

gannman
-

- Traders-Talk User
- 6,948 posts
Member
Posted 08 March 2014 - 08:51 AM
fwiw i believe a final top in the market is coming in probably mar 17 or mar 18. based on timing confluences and what i am seeing in the gold market. we will see. and i am talking about that generational top of which u speak.
feeling mellow with the yellow metal
#43
gannman
-
- Traders-Talk User
- 6,948 posts
Member
Posted 13 March 2014 - 02:22 PM
nice call kimston looks like u nailed it my man. congrats
feeling mellow with the yellow metal
#44
AChartist
-

- Traders-Talk User
- 5,800 posts
Tim
Posted 17 March 2014 - 10:38 AM
I am getting out of stocks coming up but I was still thinking they will
do one massive mass wealth transfer currency evisceration QE through 2015.
The economic disasters right now, followed by a planned market decline will
serve their premise for it.
These things like occult WWIII have a cadence, we don't know the time and cycles,
it doesnt necessarily get out of control now.
I would most likely be buying a low this year, or at least trading one.
"marxism-lennonism-communism always fails and never worked, because I know
some of them, and they don't work" M.Jordan
#45
Kimston
-
- Traders-Talk User
- 604 posts
Member
Posted 21 April 2014 - 09:12 PM
After a bit more analysis, my timing work is pointing to 4/23/14 as the on-time day for the next swing high, one day later than the date mentioned in my last post in this thread. If we do top around this time, my analysis suggests the on-time day for a potential low is 5/16/14 followed by a bounce and a lower low likely around 7/11/14. I would give the dates a trading day or two either way, but would be most alert for potential reversal on the on-time date. Price-wise, I think the swing down into mid May, if it occurs, should break below the 4/11/14 low and perhaps approach or even breach the 2/3/14 low. It's all theoretical speculation, as is every forecast about potential future events.
Kimston
#46
Kimston
-
- Traders-Talk User
- 604 posts
Member
Posted 05 May 2014 - 07:40 AM
In my analysis there is mounting evidence that an important, most likely generational top is being made in stocks(for now). Generational tops take time - much longer than most, including me, ever thought they could. Some of the long term charts and projections I've been looking at are posted below, some of which are the basis for starting this thread many months ago. Some of the secondary indexes like the Russell 2000 and Nasdaq have been weakening and leading to the downside, while the DJIA and S&P continue to be levitated near the highs.
Additional analysis is annotated on each chart. Some of these are updates to charts and analysis posted earlier, with recent market action confirming the prior analysis; i.e., the megaphone patterns in DJIA and Russell 2000 are still valid. As noted on some of the charts, it's too early to tell if the tops are actually in yet, so breaches of the highs should be respected for possible runs to higher targets. The very long-term chart of the DJIA has what I believe to be very compelling analysis, showing a triple confluence at current highs. The projections are from the 1929 top and 1932 low, the 1937 top and 1973 top, and the 1974 low. These are some of the most important swing points of the last century.
Not included on the charts is the current astro set-up. With the recent passing of the Grand Cardinal Cross followed by a new moon and solar eclipse on the same day, we'll see over the next few weeks or months if any significant price destruction occurs. In past major astro setups, like 1987 for example, there was a fairly similar signature in the heavens that preceded the crash by several months. I suppose it's fairly unlikely to happen in the next few months (mainly because most crashes tend to occur in the Fall), but it is something to be aware of just in case.
Kimston
#47
Kimston
-
- Traders-Talk User
- 604 posts
Member
Posted 02 June 2014 - 10:49 PM
Additional time analysis points to a potential top on or near 6/3/14 and a possible swing low on or near 6/10/14, followed by a rally back up near or above the 6/3 top (if there is a top in the 6/3 window). If a rally does ensue out of the 6/10 area, I would look for final swing highs around 6/16/14 before a larger swing down into the 7/10 to 7/11 area (+/- a trading day or two). I'm doing timing analysis and projections using the Russell 2000 lately, which is what these current projections are based on. The way the SP keeps levitating, I wouldn't be surprised if 6/16/14 window brings a new all-time highs while the Russell should not get much above the 50-70 percent retrace area of the decline since March. As usual, any of the projected turns could invert regarding the polarity. So, whichever way the market is trending into a CIT date, I would look for evidence of a reversal in trend.
Best guess summary:
Top around 6/3/14
Low around 6/10
Top around 6/16
Then larger decline into 7/10-11 area.
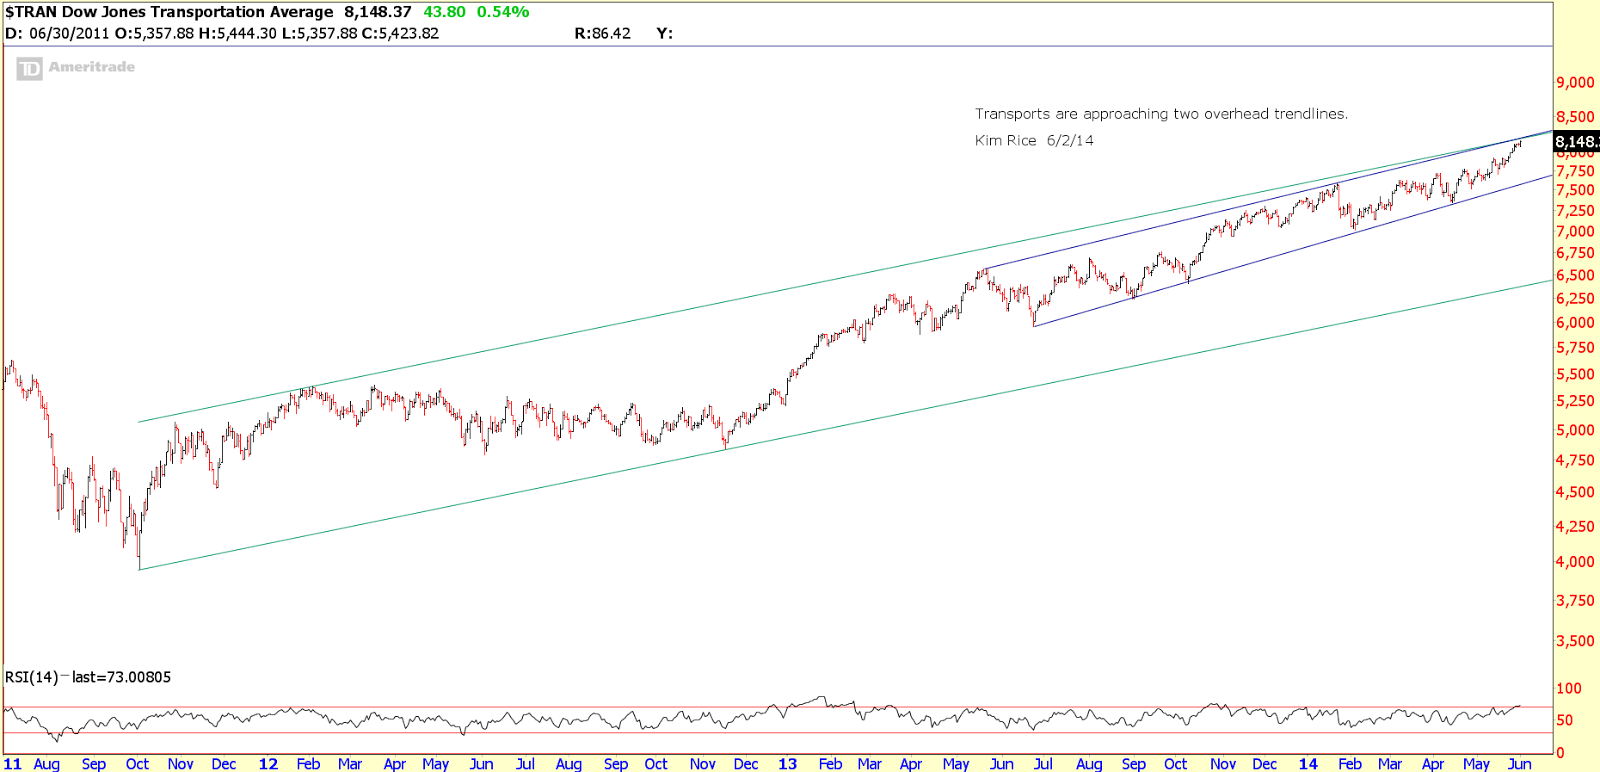
The DJT index has been about the hottest sector around and is rapidly running up to two separate trend-lines that converge in the 8170 to 8200 range. We'll see fairly soon if this area acts as resistance just as we are coming into a timing window for a potential reversal 6/3/14 (+/- a day or two).
It's all highly speculative and probabilities based as usual.
Kimston
Best guess summary:
Top around 6/3/14
Low around 6/10
Top around 6/16
Then larger decline into 7/10-11 area.
The DJT index has been about the hottest sector around and is rapidly running up to two separate trend-lines that converge in the 8170 to 8200 range. We'll see fairly soon if this area acts as resistance just as we are coming into a timing window for a potential reversal 6/3/14 (+/- a day or two).
It's all highly speculative and probabilities based as usual.
Kimston
#48
Kimston
-
- Traders-Talk User
- 604 posts
Member
Posted 15 June 2014 - 05:45 PM
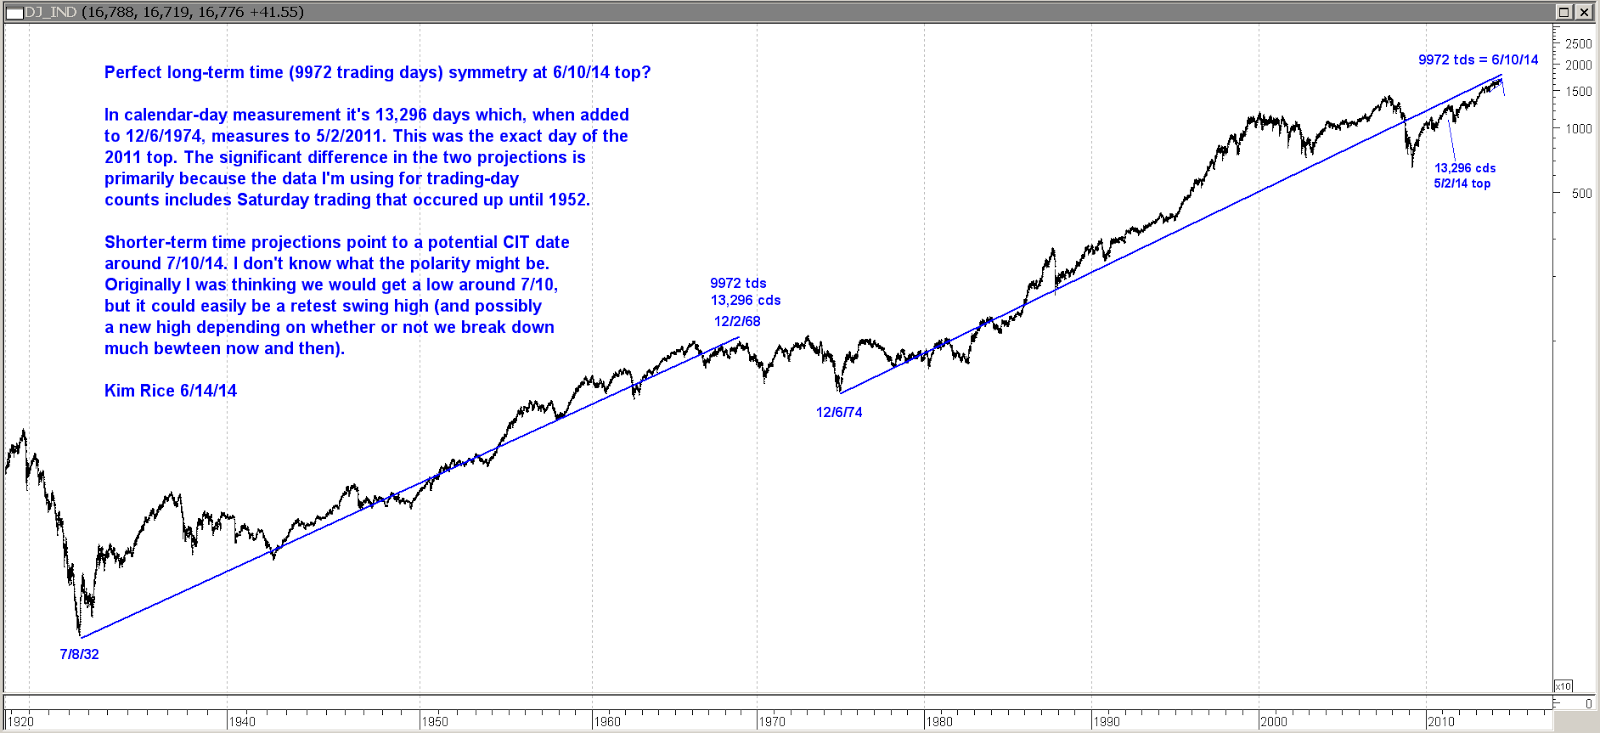
I found some very interesting long-term time symmetry as shown on the first chart below. The 9972 trading-day time period matches the 1932 to 1968 period but the number itself is also interesting because it's a factor of two different multiples of phi (161.8 x 61.63 = 9972). I think this adds to evidence of an important top being made. I would guess it's a fairly high probability that 6/10/14 marked the top of the bull move from the 2009 lows.
Per the second chart, I would guess there's at least a 10 to 20 percent chance that the DJIA and SPX make one more push to new highs unless those indicies break the Feb 2014 lows.
It looks like I had some inverted guesses for polarity of CIT dates mentioned in the previous post in this thread. Polarity is always the hardest to guess in advance. Going forward, of course there is always a chance that all of this analysis is incorrect and the market just continues on up without a significant correction.
Kimston 6/15/14
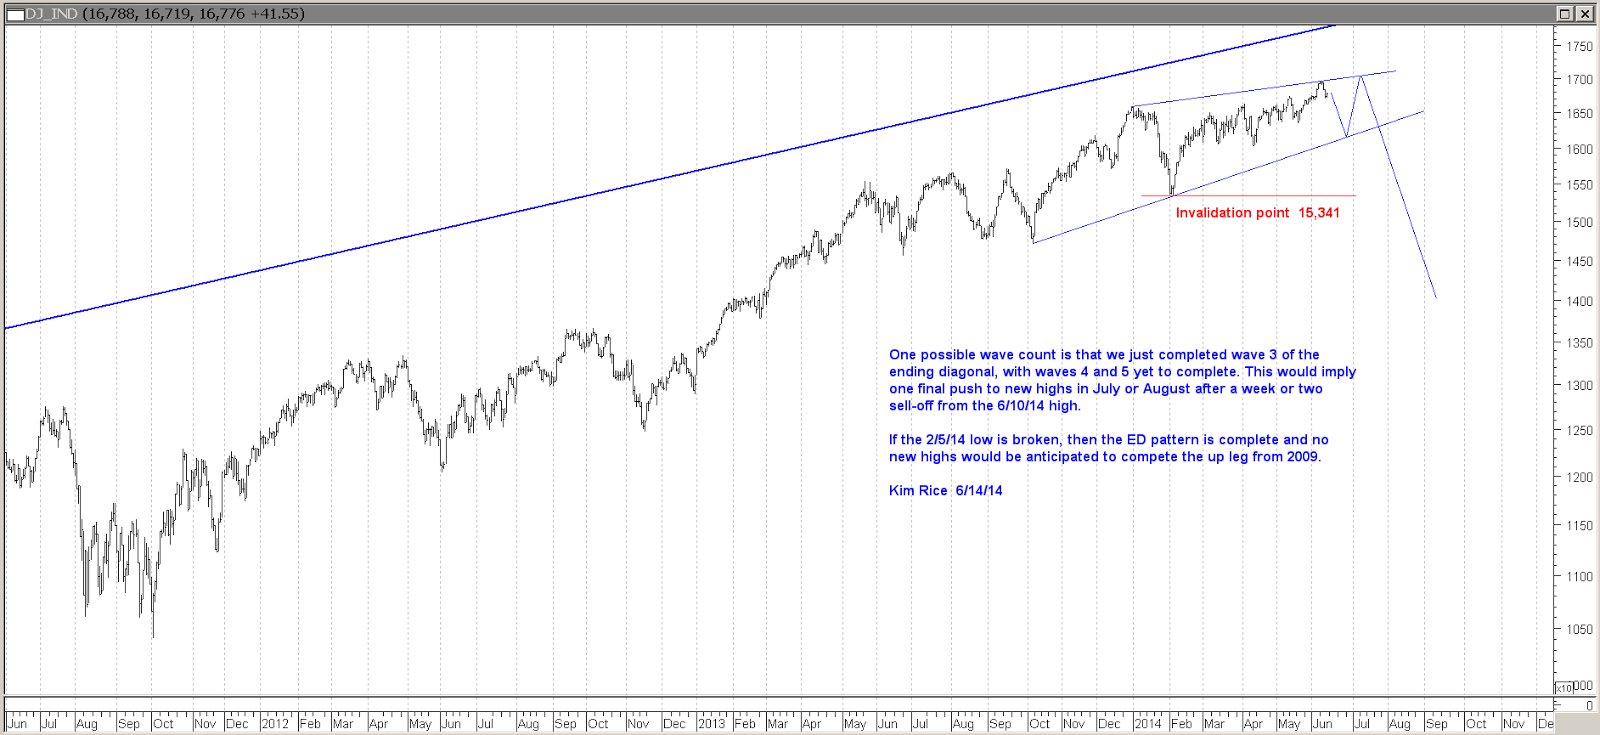
#49
Kimston
-
- Traders-Talk User
- 604 posts
Member
Posted 22 June 2014 - 06:04 PM
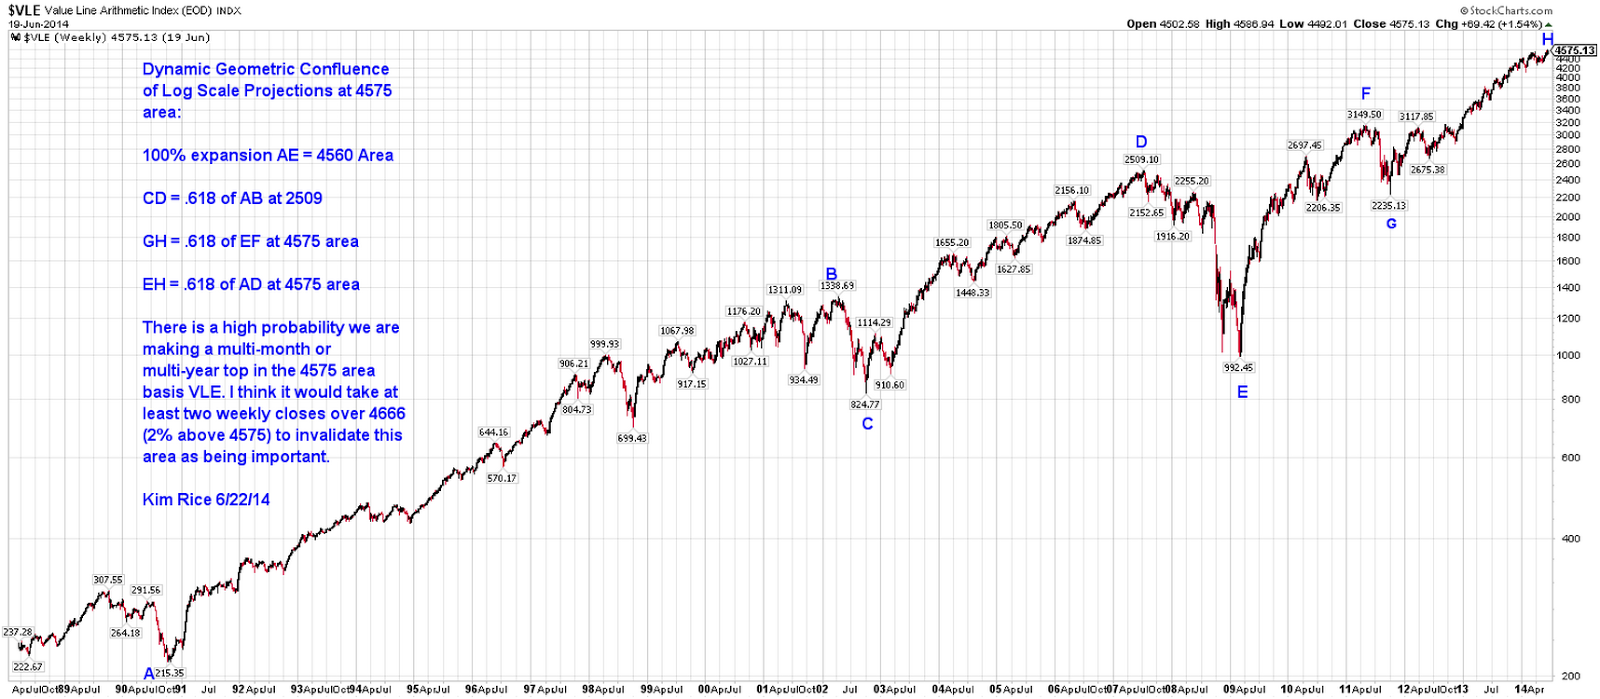
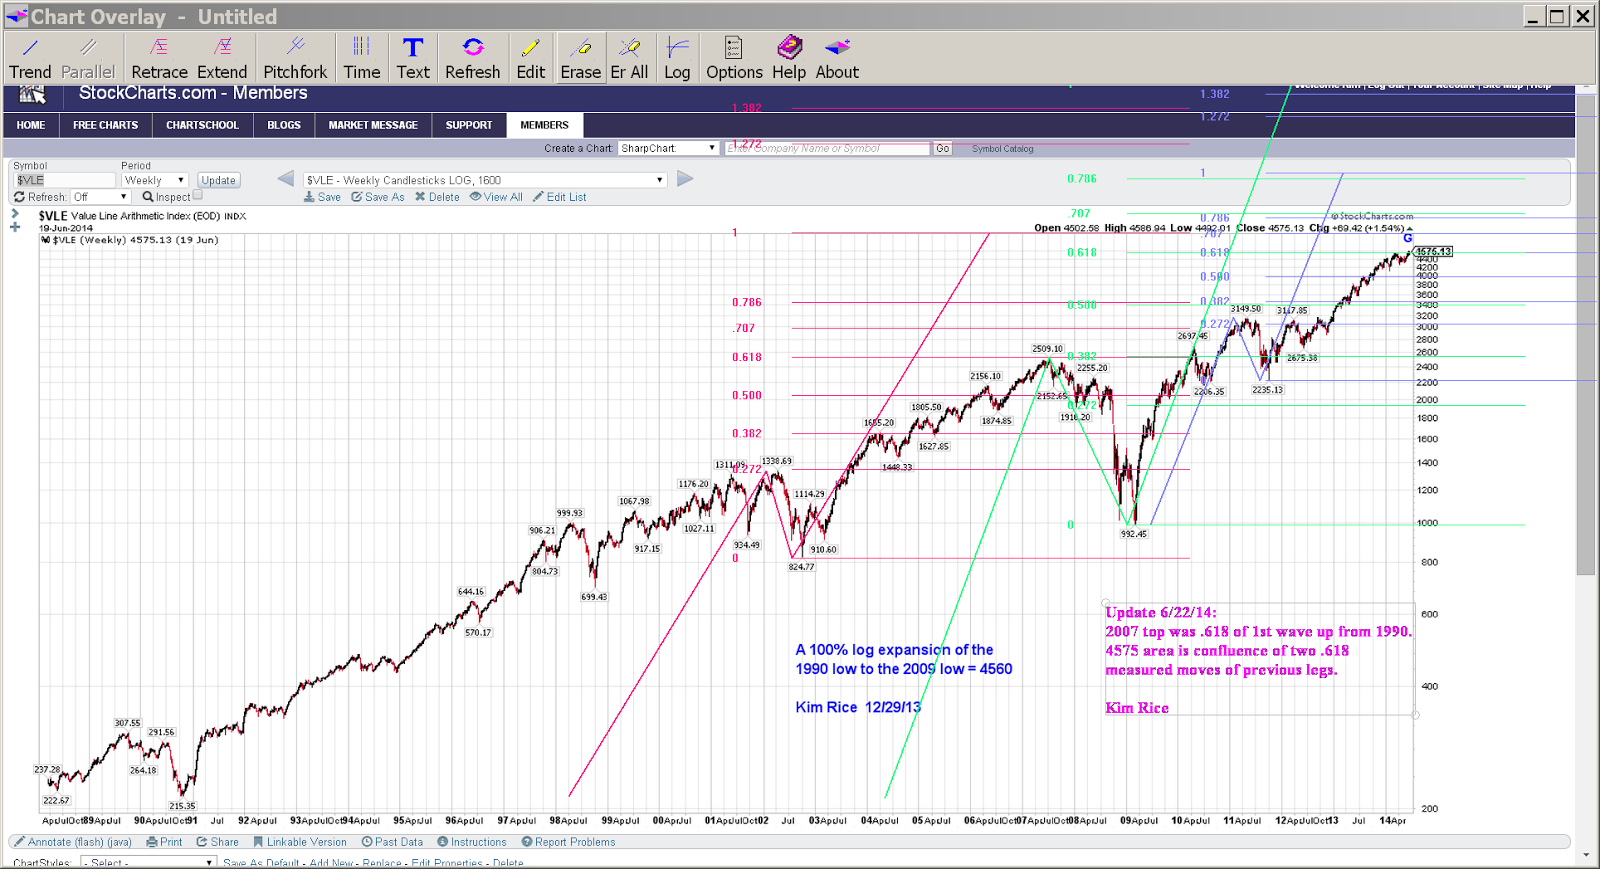
Posted below are several charts showing the dynamic price projections and perfect fibonacci relationships at the 4575 area on VLE, all based on log scale measurements. This is additional, very compelling evidence of a potential major top right at or near current prices as of 6/20/14. So now we have a major price confluence occurring in the window of the very long-term time projections posted here on 6/15/14. The pattern and wave relationships of the two legs up from the 2009 low appear to be a fractal of the larger two-leg pattern from the 1990 low to the present, and the 2009-2014 legs up appear to be a smaller fractal of the 1990 to 2000 legs up. Under the multiple fractal scenario, the correction from May to Oct of 2011 is the small fractal of the 2007 to 2009 down leg, and this presumed top in 2014 is at least equivalent to the 2007 top.
Analysis and additional comments are annotated on the charts posted below.
Kimston 6/22/14

Analysis and additional comments are annotated on the charts posted below.
Kimston 6/22/14
#50
Kimston
-
- Traders-Talk User
- 604 posts
Member
Posted 30 June 2014 - 01:41 PM
Based on some timing and pattern analysis I'm looking at in stocks, the sideways chop since the 6/24/14 outside day reversal should end 6/30 or 7/1 area and begin trending down thereafter. The next timing confluence I see is 7/15/14 +/- a trading day or two. My best guess regarding polarity is that it will likely be a low in that time-frame, but won't know until we get there.
Kimston


