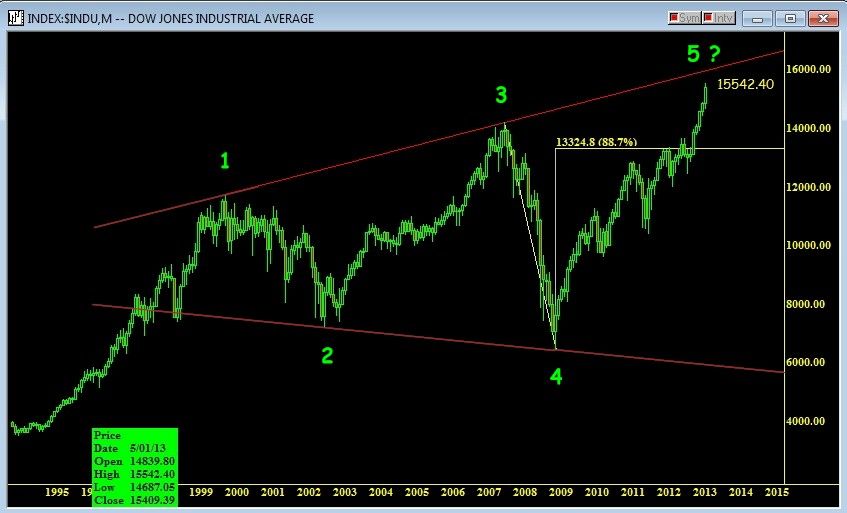
the red line nobody seems to care about http://www.siliconin...?msgid=28919938
Thank chief you are a very welcome addition here IMO! You keep my thoughts, expectations ballanced. Many reliable turn indicaters are saying bottom an about 30% are saying not quite yet. Vst indicaters are starting to point back down as of fridays close. A week close monday will seal that. IF that happens at min. A double bottom is at hand. Trying to stay open minded....
O
Just did so, again thank you very much. For your sharing as well as you willingness to swim against the current. Its good to keep eyes looking both ways before crossing the street!
> willingness to swim against the current.<......wrong //// i go with the current.......its the bears that are swiming against the current eh? snort
that redline ive been focusing on since the 09 bottom .....click on responses and you will see what is coming once that red line is penetrated
http://www.siliconin...?msgid=28377889

WEEKEND FORECAST
Started by
TechMan
, Sep 08 2013 09:15 AM
52 replies to this topic
#11

da_cheif
-

- Traders-Talk User
- 10,960 posts
Member
Posted 08 September 2013 - 12:15 PM
#12
da_cheif
-
- Traders-Talk User
- 10,960 posts
Member
Posted 08 September 2013 - 12:18 PM
im assuming you were looking at something that is bearish to you...if so if you look at the november bottom in the spx that other chart caught up much later/it didnt mean anything at the last bottom eitherIf anyone's keeping track of this...
Please elaborate.


#13
selecto
-

- Traders-Talk User
- 6,871 posts
Member
Posted 08 September 2013 - 12:25 PM
the red line nobody seems to care about http://www.siliconin...?msgid=28919938
More than one red line on that chart worth caring about.

#14
da_cheif
-
- Traders-Talk User
- 10,960 posts
Member
Posted 08 September 2013 - 12:28 PM
the red line nobody seems to care about http://www.siliconin...?msgid=28919938
More than one red line on that chart worth caring about.
with well rounded ta the push thru that line is a forgone conclusion.....

http://www.siliconin...?msgid=29099336
your 1234 shud read abc2 your 5 is an unfolding 3
Edited by da_cheif, 08 September 2013 - 12:32 PM.
#15
TechMan
-
- Traders-Talk User
- 7,663 posts
Member
Posted 08 September 2013 - 12:33 PM
im assuming you were looking at something that is bearish to you...if so if you look at the november bottom in the spx that other chart caught up much later/it didnt mean anything at the last bottom eitherIf anyone's keeping track of this...
Please elaborate.
That November 2012 low is actually bullish, as I had called the bottom there. However, what's really bearish is the May 2013 top. And, the Point & Figure Bullish % Index has it right there. Why's that "didn't mean anything"? We're currently trading below that 5/22/13 intraday high by about 2%.
Edited by TechMan, 08 September 2013 - 12:40 PM.
#16
CLK
-

- Traders-Talk User
- 10,787 posts
Member
Posted 08 September 2013 - 12:57 PM
No matter what kind of system one uses, the fact remains that 95% of all TRADERS lose money, you can have a well tuned 80% system
but there is still only a 5% chance you will survive, most of those 5% likely represent Goldman elites and politicians that front run their
own decisions.
#17
da_cheif
-
- Traders-Talk User
- 10,960 posts
Member
Posted 08 September 2013 - 01:39 PM
No matter what kind of system one uses, the fact remains that 95% of all TRADERS lose money, you can have a well tuned 80% system
but there is still only a 5% chance you will survive, most of those 5% likely represent Goldman elites and politicians that front run their
own decisions.
>most of those 5% likely represent Goldman elites and politicians that front run their
own decisions.< clx students and ewave students that are in the minority also front run the markets...675ono
#18
da_cheif
-
- Traders-Talk User
- 10,960 posts
Member
Posted 08 September 2013 - 01:40 PM
only the minority are long for the blastim assuming you were looking at something that is bearish to you...if so if you look at the november bottom in the spx that other chart caught up much later/it didnt mean anything at the last bottom eitherIf anyone's keeping track of this...
Please elaborate.
That November 2012 low is actually bullish, as I had called the bottom there. However, what's really bearish is the May 2013 top. And, the Point & Figure Bullish % Index has it right there. Why's that "didn't mean anything"? We're currently trading below that 5/22/13 intraday high by about 2%.

#19
Kimston
-

- Traders-Talk User
- 604 posts
Member
Posted 08 September 2013 - 01:43 PM
Just because there's a trendline around 16,000 on DJIA, it doesn't mean the market has to get there (or go through it). I would point out that the last major megaphone pattern was back in the 1966 to 1973 period. In the S&P, the market never made it to the upper trendline. After the 1973 peak, the market melted down into the 1974 low and took out prior swing lows of the pattern in the process.
Don can't make any guarantees and neither can I when forecasting market movements, but the weight of the evidence I'm looking at (and have posted about) suggests we follow the path after the 1966-73 megaphone pattern. This is purely technical based on historical comparisons and major pirce and time projections. If the DOW does push significantly above 16,000, that would invalidate what I'm looking at. BTW the Dow ETF did hit the upper line.
Kimston
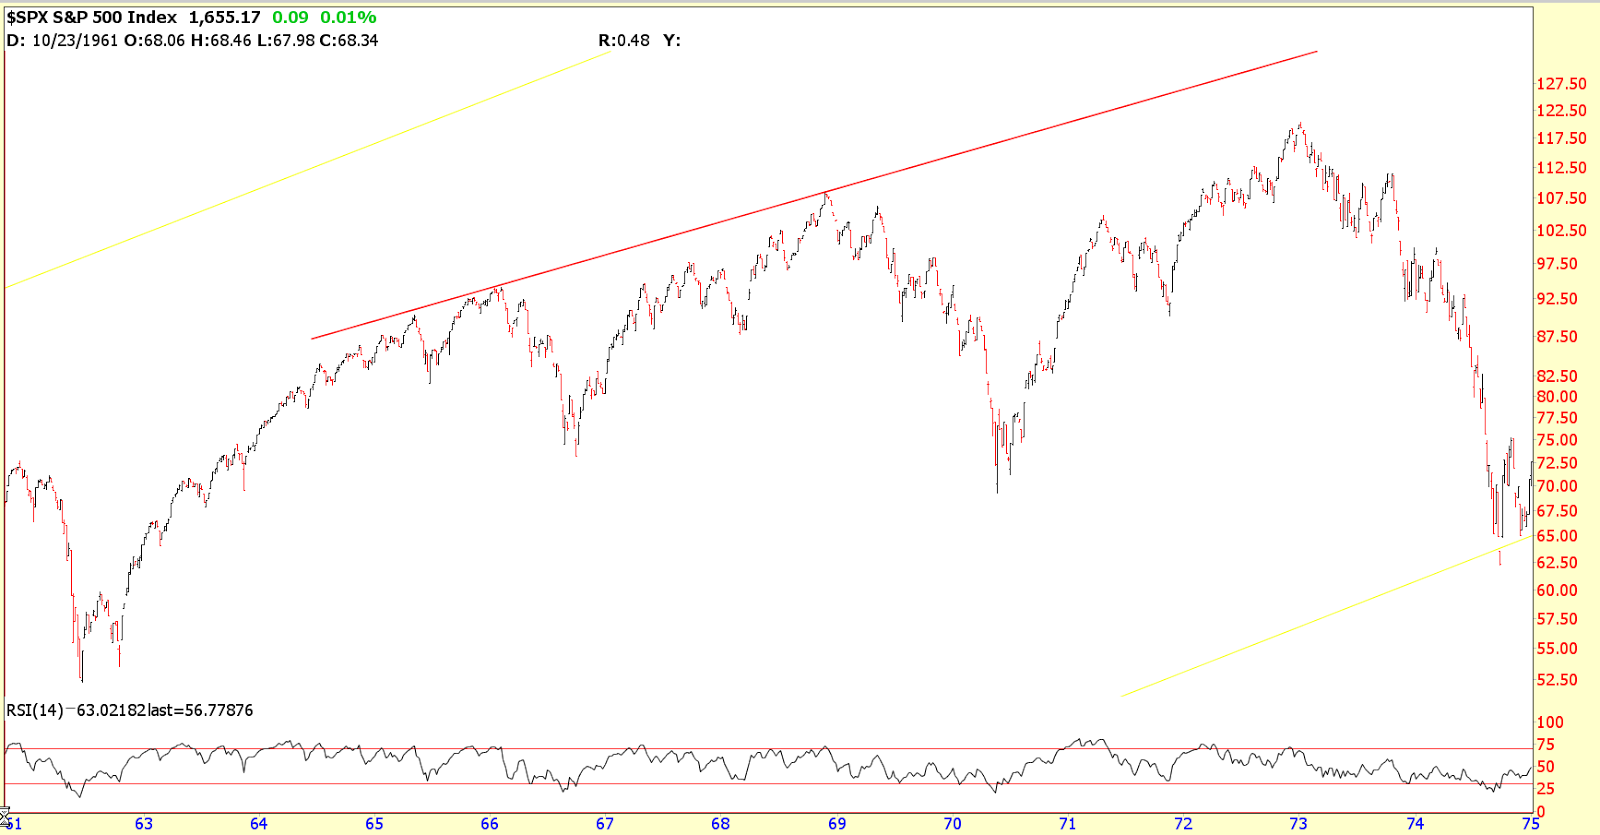
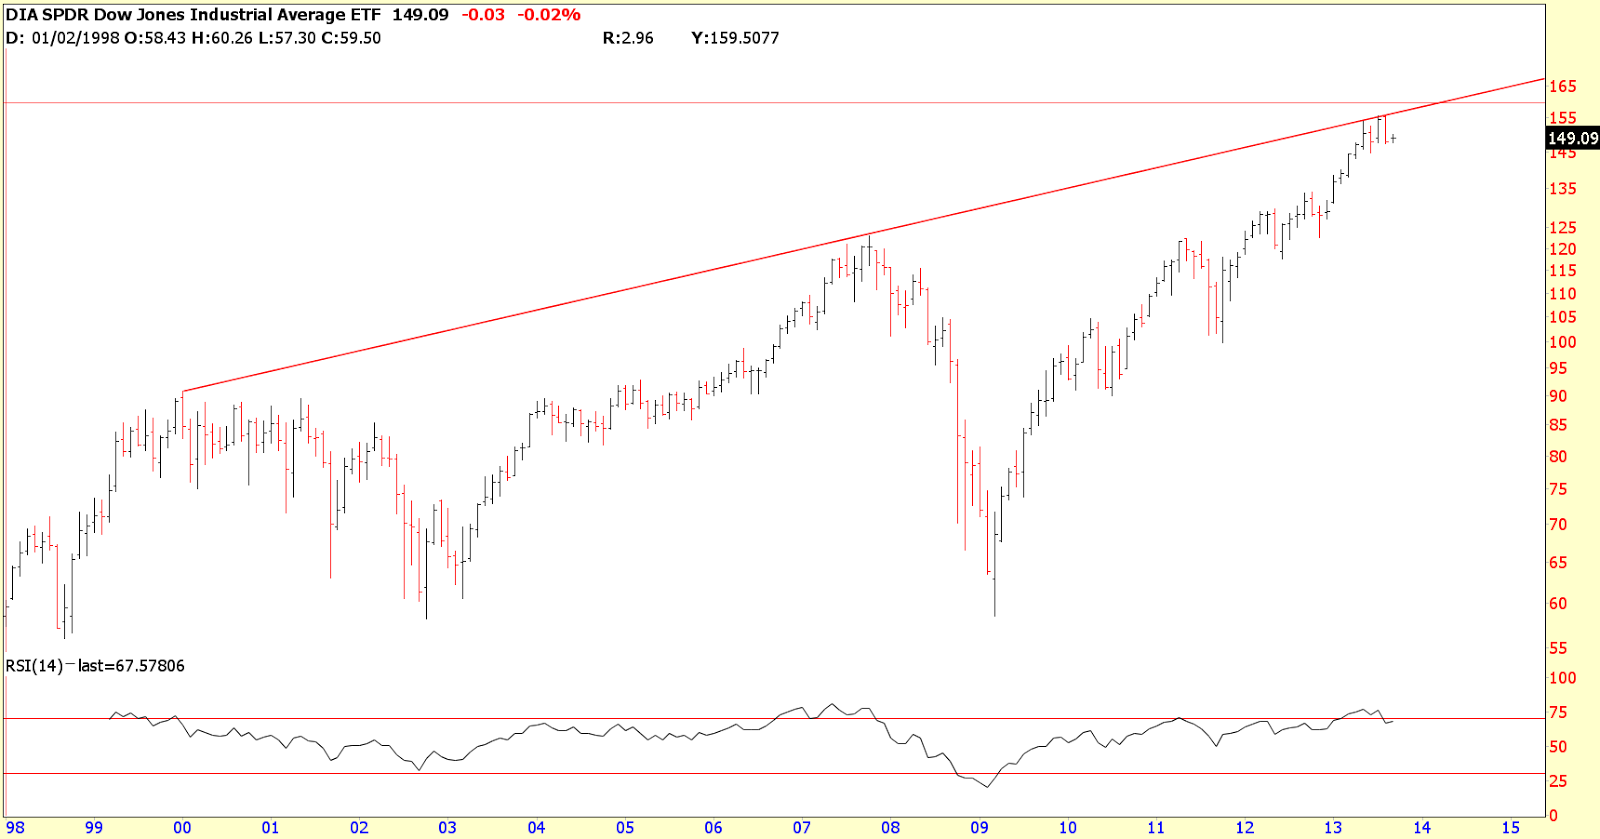
#20
PrintFaster
-

- Traders-Talk User
- 1,683 posts
Member
Posted 08 September 2013 - 01:46 PM
Where is the next TSLA-style stock that could ramp huge the next 12 months?
SANTA CLARA, Calif., Sep 05, 2013 (BUSINESS WIRE) -- Infoblox BLOX +15.47% , the automated network control company, today reported its financial results for its fourth fiscal quarter and fiscal year ended July 31, 2013. Total net revenue for the fourth quarter of fiscal 2013 was a record $63.1 million, an increase of 40% on a year-over-year basis. Total net revenue for fiscal 2013 was a record $225.0 million, an increase of 33% compared with the total net revenue of $169.2 million in fiscal 2012.
"By all measures, Infoblox had another outstanding quarter and another very strong fiscal year," said Robert Thomas, president and chief executive officer. "Revenue in the fourth quarter increased 40% year-over-year and was driven by strong product sales, which were up 52% year-over-year. From a bottom-line perspective, we reported solid non-GAAP operating profitability while still investing significantly in our business. Going forward, we enter fiscal 2014 with significant momentum and expect it to be another year of strong execution."
http://www.infoblox....CFa9cQgodySEAfg
http://stockcharts.c...78665598095.png


