
Only 2 points in 13 years. Drawn no better than the 13-year triangle chart I've seen of the tops and bottoms claiming we'll get SPX 400.
"It takes two or more points to draw a trend line. The more points used to draw the trend line, the more validity attached to the support or resistance level represented by the trend line. It can sometimes be difficult to find more than 2 points from which to construct a trend line. Even though trend lines are an important aspect of technical analysis, it is not always possible to draw trend lines on every price chart. Sometimes the lows or highs just don't match up, and it is best not to force the issue. The general rule in technical analysis is that it takes two points to draw a trend line and the third point confirms the validity."
http://stockcharts.c...sis:trend_lines

WEEKEND FORECAST
Started by
TechMan
, Sep 08 2013 09:15 AM
52 replies to this topic
#32

CRUISENAL
-

- Traders-Talk User
- 1,135 posts
Member
Posted 08 September 2013 - 03:45 PM
The comments were addressed to Kim and wasn't asking for anyone else to comment. I have my reasons for agreeing with Kim. Just disregard my post. Alan
>. Both INDU & S&P look to have topped. < oh really......since when does the market top with less tham 40% in the marketKim,
I am with you on this one. Both INDU & S&P look to have topped. NAsdaq and NDX maybe, maybe not. Should know more the next ten trading days. If we do see a 73-74 decline it's going to be a Dusey! Alan
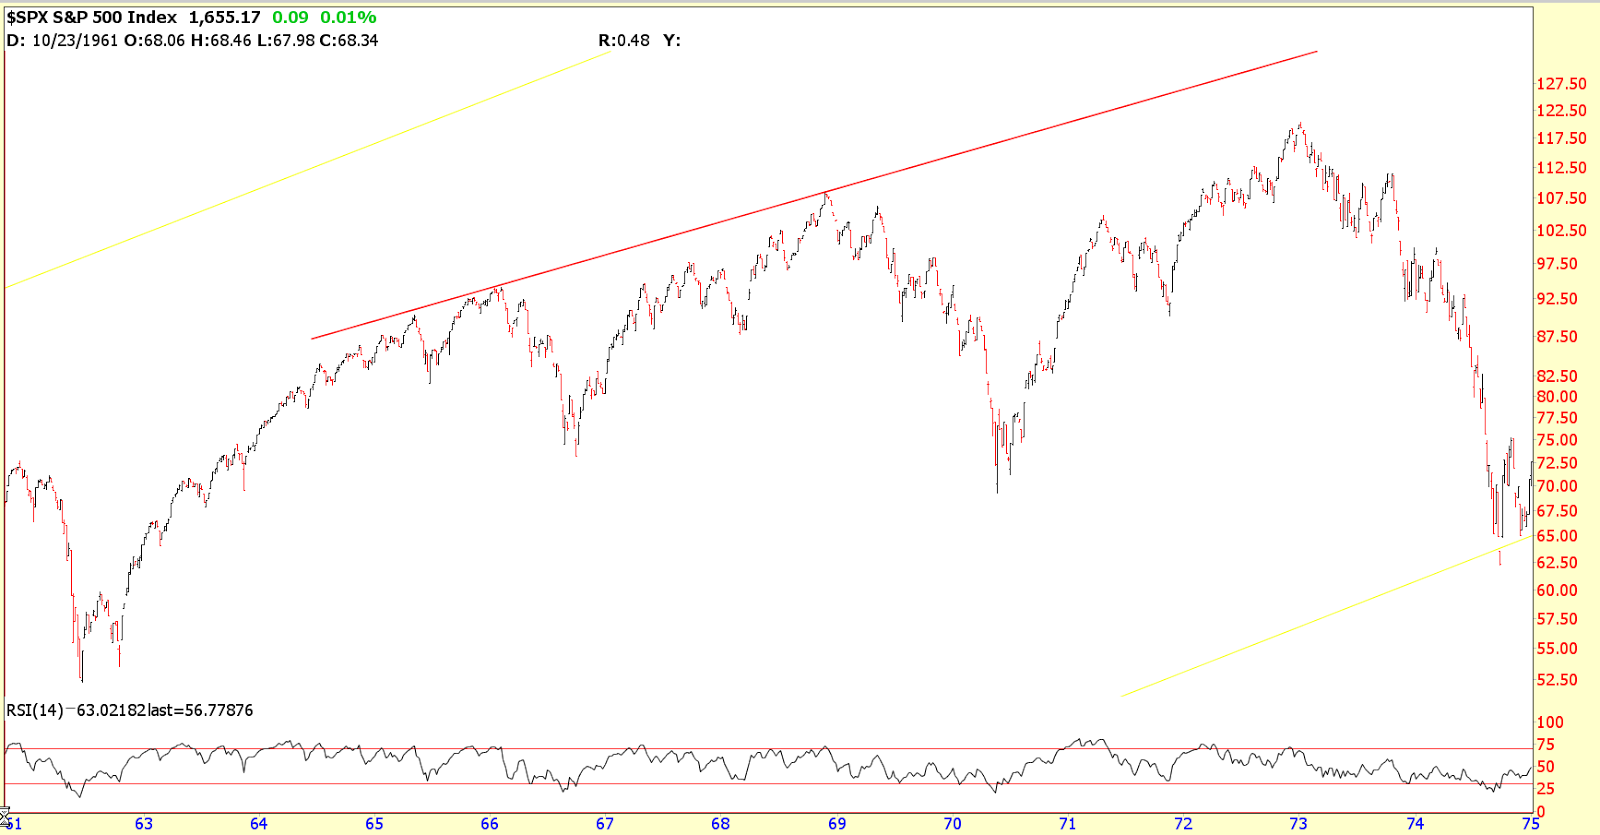
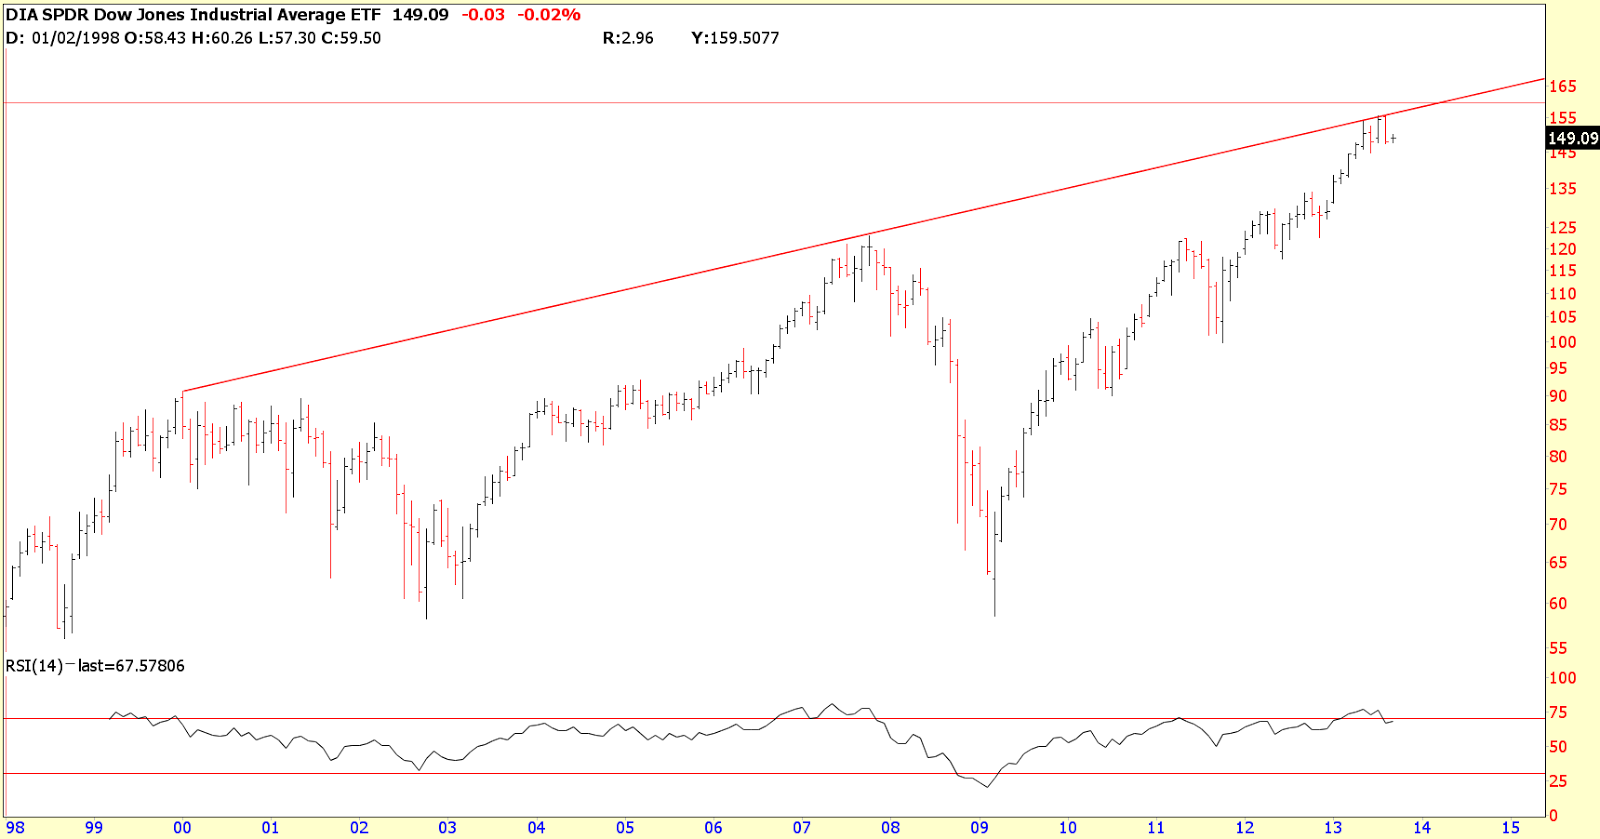
Just because there's a trendline around 16,000 on DJIA, it doesn't mean the market has to get there (or go through it). I would point out that the last major megaphone pattern was back in the 1966 to 1973 period. In the S&P, the market never made it to the upper trendline. After the 1973 peak, the market melted down into the 1974 low and took out prior swing lows of the pattern in the process.
Don can't make any guarantees and neither can I when forecasting market movements, but the weight of the evidence I'm looking at (and have posted about) suggests we follow the path after the 1966-73 megaphone pattern. This is purely technical based on historical comparisons and major pirce and time projections. If the DOW does push significantly above 16,000, that would invalidate what I'm looking at. BTW the Dow ETF did hit the upper line.
Kimston
#33
da_cheif
-

- Traders-Talk User
- 10,960 posts
Member
Posted 08 September 2013 - 04:47 PM
Only 2 points in 13 years. Drawn no better than the 13-year triangle chart I've seen of the tops and bottoms claiming we'll get SPX 400.
"It takes two or more points to draw a trend line. The more points used to draw the trend line, the more validity attached to the support or resistance level represented by the trend line. It can sometimes be difficult to find more than 2 points from which to construct a trend line. Even though trend lines are an important aspect of technical analysis, it is not always possible to draw trend lines on every price chart. Sometimes the lows or highs just don't match up, and it is best not to force the issue. The general rule in technical analysis is that it takes two points to draw a trend line and the third point confirms the validity."
http://stockcharts.c...sis:trend_lines
the general rule in technical analysis????? lol ...what everybody knows is worthless
 ......and whoever wrote this knows nothing about TA >Technical analysis is built on the assumption that prices trend. Trend Lines are an important tool in technical analysis for both trend identification and confirmation. A trend line is a straight line that connects two or more price points and then extends into the future to act as a line of support or resistance. Many of the principles applicable to support and resistance levels can be applied to trend lines as well. It is important that you understand all of the concepts presented in our Support and Resistance article before you continue. <
Edited by da_cheif, 08 September 2013 - 04:51 PM.
#34
kssmibotm
-

- Traders-Talk User
- 653 posts
Member
Posted 08 September 2013 - 07:08 PM
the general rule in technical analysis????? lol ...what everybody knows is worthless
I know you have paying subs, which restricts you on how much you can reveal on a free site like this. But... with all due respect, you must have more in the TA tool box than two points on chart to justify your bullish stance.

KMB
People think the Holy Grail is something looked for but never found. In fact, it is something often found but rarely recognized.
#35
da_cheif
-
- Traders-Talk User
- 10,960 posts
Member
Posted 08 September 2013 - 07:14 PM
WHAT i have is available to everybody and it does show up here.....but few could care less.....does anybody care about sentiment......does any body care for any other index cept the spy or dow or sp.......does anybody care about the weekly ad line .......does anybody REALLY care that they worry to much....does anybody care that the owner of this place has been bullish for months.......does anybody care lolololthe general rule in technical analysis????? lol ...what everybody knows is worthless
I know you have paying subs, which restricts you on how much you can reveal on a free site like this. But... with all due respect, you must have more in the TA tool box than two points on chart to justify your bullish stance.
KMB
#36
CLK
-

- Traders-Talk User
- 10,787 posts
Member
Posted 08 September 2013 - 08:15 PM
I believe there are better avenues to make money besides trading financial instruments. Shorting is tough these days,
eventually it will pay off, otoh I don't see any upside justifying putting a large sum to work long, either. If we get another
50% repricing to the downside I will know what to do, otherwise, I am limiting my trading to sparse high odds setups,
from what I have developed over the years. I have trouble waiting days to weeks for the better ones, almost always I get
impatient and force something, most of this is because I have all my eggs in one basket, trading the market, so I am going
to diversify into real estate before I impatiently chop through the rest of my capital. I have no problem with putting a lot
into real estate, it will be there when I am ready to sell, equities are just about the exact opposite. If I can, and it's very
possible, to double my money in a year or two in RE, with almost no risk, outside a couple thousand in property taxes,
I will be very satisfied.
#37
An Ant
-

- Traders-Talk User
- 216 posts
Member
Posted 08 September 2013 - 08:44 PM
>WHAT i have is available to everybody and it does show up here.....<
>...what everybody knows is worthless <
da_cheif,
What's the difference between care and REAL care?
<
da_cheif,
What's the difference between care and REAL care?
Edited by An Ant, 08 September 2013 - 08:47 PM.
#38
zoropb
-

- Traders-Talk User
- 8,392 posts
Member
Posted 08 September 2013 - 09:44 PM
After doing both for 3 decades. RE is about timing also C. you get that wrong and it takes years to get to even. Ask the folks who bought in 2003-6. Not only that but RE is a lot of hands on work, either sweat equity, tenants which is one hell of a pain in the butt at times. They try to sue you even when you did nothing wrong just to get money out of you sometimes. To liquidate positions in RE could take years depending on the the type or take a large discount if you need the money quick. So, don't think its a cake walk. If you dollar cost averaged in say the spy you would beat 85% of wall street. I tell this to investor types do not waste time in funds. Just like holding a property or spy for 20 years you will make money in both in time.I believe there are better avenues to make money besides trading financial instruments. Shorting is tough these days,
eventually it will pay off, otoh I don't see any upside justifying putting a large sum to work long, either. If we get another
50% repricing to the downside I will know what to do, otherwise, I am limiting my trading to sparse high odds setups,
from what I have developed over the years. I have trouble waiting days to weeks for the better ones, almost always I get
impatient and force something, most of this is because I have all my eggs in one basket, trading the market, so I am going
to diversify into real estate before I impatiently chop through the rest of my capital. I have no problem with putting a lot
into real estate, it will be there when I am ready to sell, equities are just about the exact opposite. If I can, and it's very
possible, to double my money in a year or two in RE, with almost no risk, outside a couple thousand in property taxes,
I will be very satisfied.
Bottom line you got to know what your doing in both if you do not want to lose money and get exceptional returns. They do not just hand it over in RE or trading in either case. The returns of the 5% is not just Goldman Sacks in fact they cannot go in and out and pick spots like independent traders so in that regard we have that advantage over them. This biz is not overnight and takes most good traders 10 years or more to reach that 5% and pay your dues to the University of trading. Sometimes you can cut this time with certain individuals but the style must be your own. No way around that.
Edited by zoropb, 08 September 2013 - 09:49 PM.
Love, be kind to one another, seek the truth, walk the narrow path between the ying and the yang.
#39
NAV
-

- Traders-Talk User
- 16,087 posts
Member
Posted 08 September 2013 - 10:17 PM
No matter what kind of system one uses, the fact remains that 95% of all TRADERS lose money,
One of my friend runs a brokerage firm. He was saying the numbers are something like 99% traders lose money. 95% is a lie. Those who make lose it within a year or two. Only 1% really make it in the long run.
you can have a well tuned 80% system but there is still only a 5% chance you will survive
You are still obsessed with winning rate. It's not the winning rate that matters but the risk/reward of your traders. Unless you maximize your profits on those big swing moves, then odds are you will go broke in the long run.
Most folks are not well capitalized to trade futures. They use leverage and go broke. If you are well capitalized and use proper position sizing, you don't have to be Goldman, morgan or some e-wave/GANN elite to make money. TA is 90% bullsh^t. Develop very very simple price-based, price following methods and you will come out a winner. You will beat all the big TA gurus who wax eloquent, hands down.
Internet forums are always filled with bears, counter-trenders and folks trying to predict the future. All three are death recipe for a trader.
Edited by NAV, 08 September 2013 - 10:19 PM.
#40
opinionated
-

- Traders-Talk User
- 4,937 posts
Member
Posted 08 September 2013 - 10:26 PM
Chief, Yes, yes, yes and yes! A few do... and your also correct about the one who runs this place. I have learned the hardest thing to do is listen and respect the trader who disagree's with you. EVEN WHEN HE OR SHE IS RIGHT! And your wrong... that is where I have grown the most.
And Z...
Very well put my friend...
Im a student, and have came to the realization that Im always going to be one. Now I can learn...
Good luck everyone this week and lets light this candle!!
O
Edited by opinionated, 08 September 2013 - 10:27 PM.


