Thursday, July 1st, 2004
Stock Market
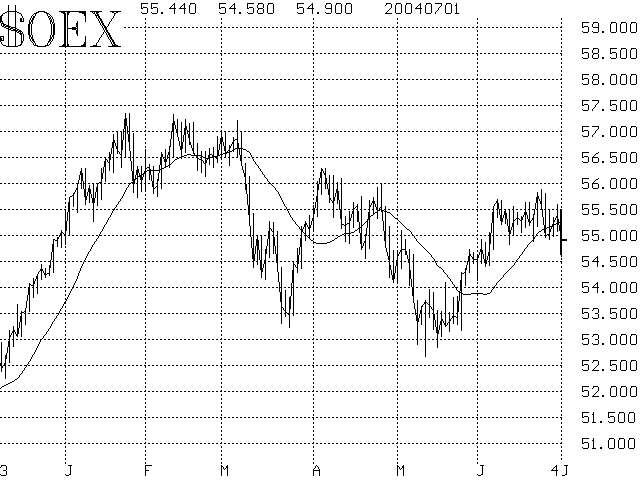
The market had waited patiently for the Fed to make its announcement (a modest 1/4 point increase in the Fed Funds rate). Traders had hoped that the Fed's action might cause the market to break out of its trading range. It didn't happen that way, as the market rallied modestly after the Fed's announcement yesterday afternoon, but remained within its recent trading range. Thursday was another story. The market decisively moved lower intraday, and nearly broke below the recent lows. If the market closes below June's lows, the whole technical picture would become more bearish.
Thursday's selloff could be somewhat related to the upcoming holiday weekend, but I think it has more to do with traders being disappointed that once again the market couldn't break out on the upside. They have determined that the path of least resistance may now be the downward one.
Let's review the technical indicators: Breadth wasn't all that bad Thursday on the NYSE, but that's because the bond market was rallying modestly, which boosts advancing issues. It would take a second day of this type of negative action to turn breadth to a sell signal.
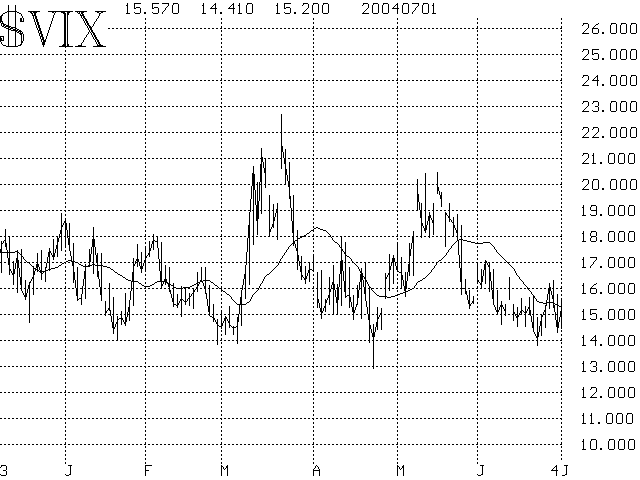
Volatility indices (Figure 4) were up only modestly in Thursday's decline. And they were not up enough to generate sell signals. Both $VIX and $VXO declined precipitously Wednesday after the Fed news dropping to 14 or so. Now they are back above 15, but it will take a move above 17 to declare them as bearish.
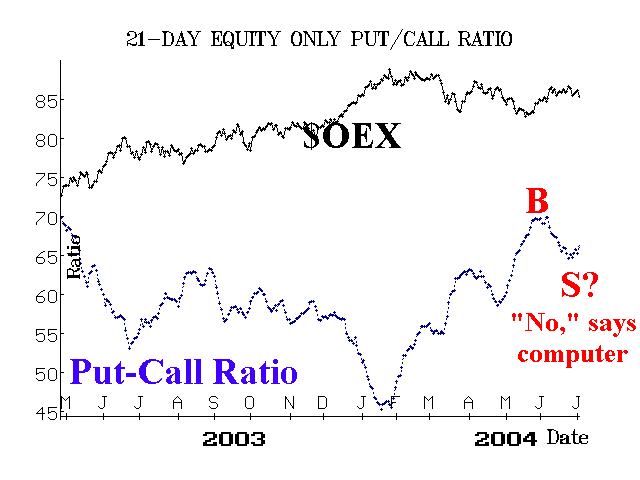
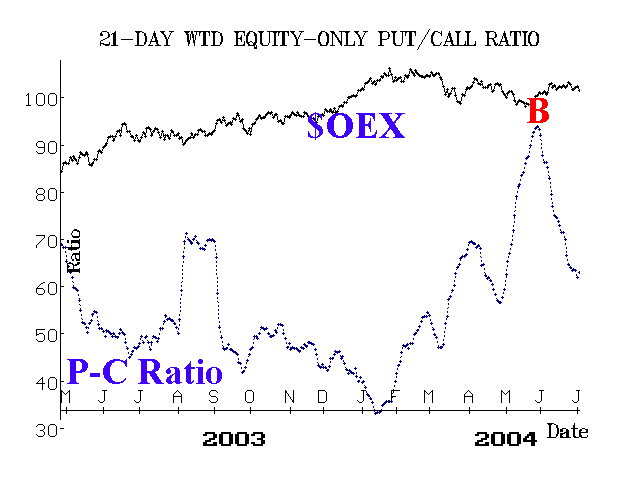
Equity-only put-call ratios are shown in Figures 2 and 3 . The standard ratio is has been "wiggling" higher lately, and appears to be rolling over to a sell signal. However, our computer projections indicate that -- even if this is technically a sell signal -- it will reverse back to a buy signal very soon. The weighted ratio remains on a buy signal.
So, the above three technical indicators don't look all that bad. The biggest problem is price (see Figure 1), and a breakdown below the June lows would leave behind a very stubborn resistance area, at a minimum. The market tried numerous times during June to break out to the upside, but just couldn't do it. The failures of the last two Thursdays to follow through on the preceding Wednesdays now looms large. $OEX has the worst chart of the three ($SPX, $OEX, and $DJX). Even with Thursday's action, though, none of the three have
broken below their June lows. They are certainly close, of course, but if they hold here, they'll still be within their recent trading range, which is much better than being below it.
Many traders -- including this one -- had expected the market to challenge its yearly highs this summer. That seems much less likely now. This is not to say that the market can't rally (in fact, if this downside move is a fakeout/shakeout, it would be in classic contrarian style), but the odds of a rally have certainly diminished.


