

Weekly Breadth Data, Week Ending January 16, 2015
In another week of high volatility thrills and chills, the US markets finally backed and filled their way down an average of .93%, week over week, with the NASDAQ Composite showing the largest loss of 1.48% while the S&P 600 Small Cap Index (SML) was only lower by a mere .36%.
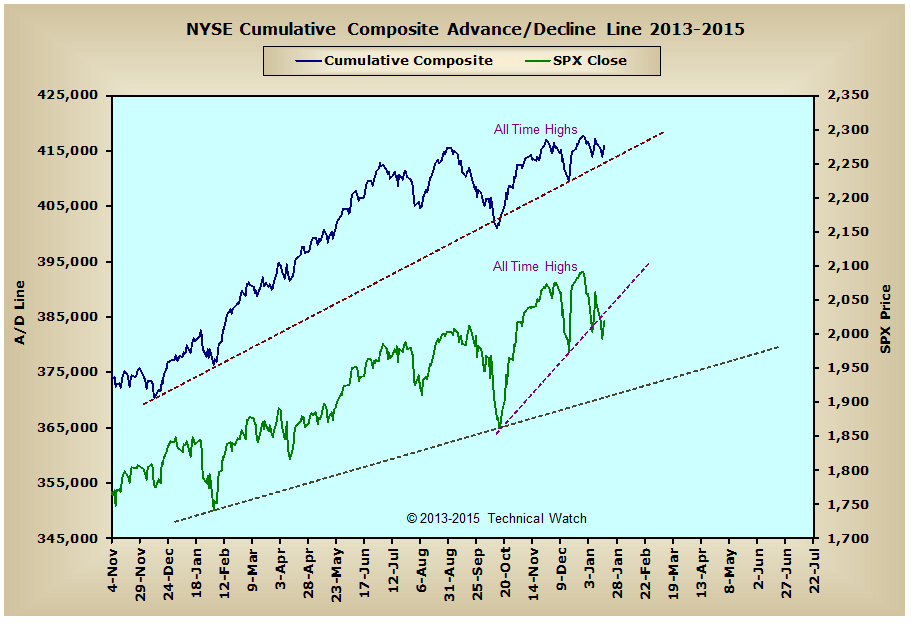
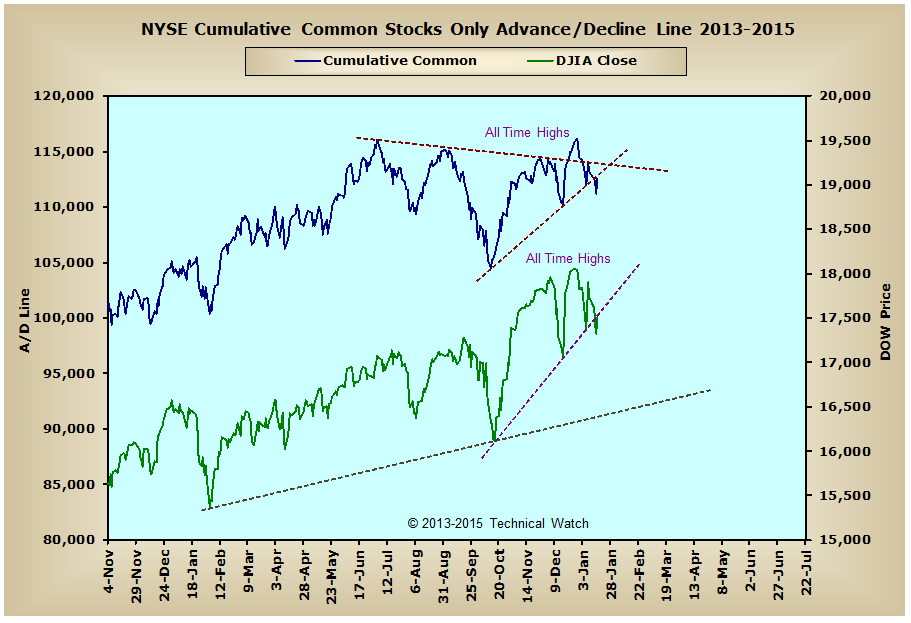
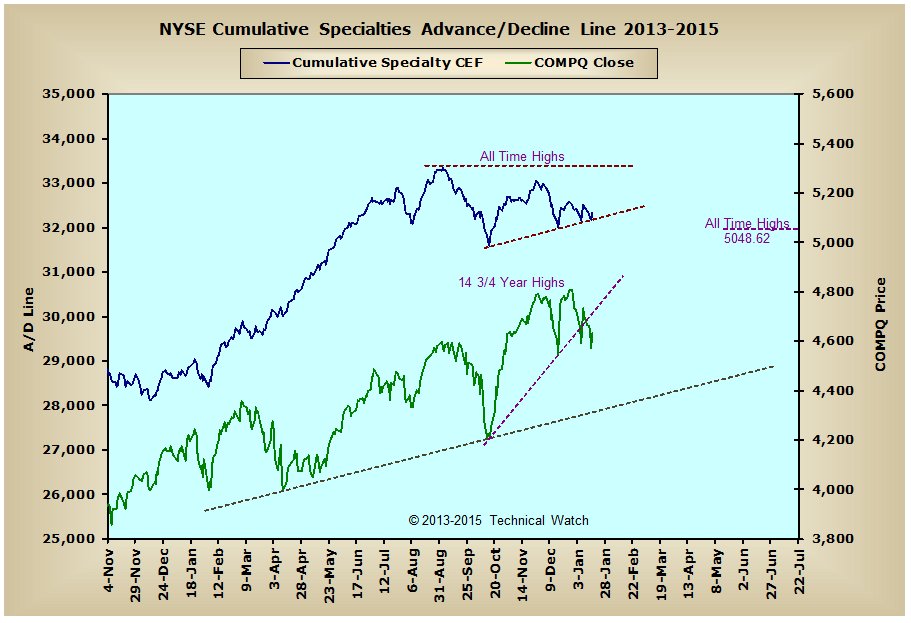
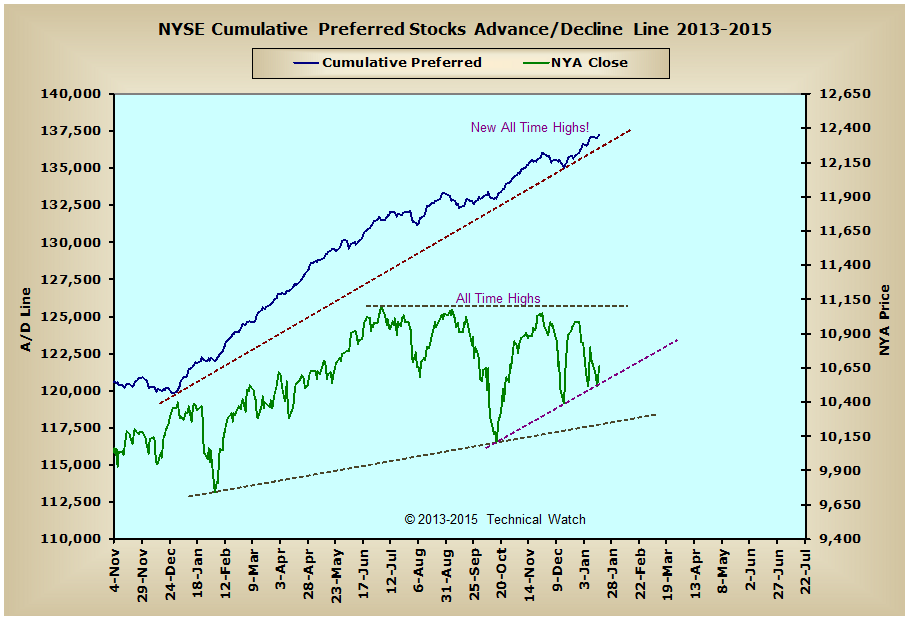
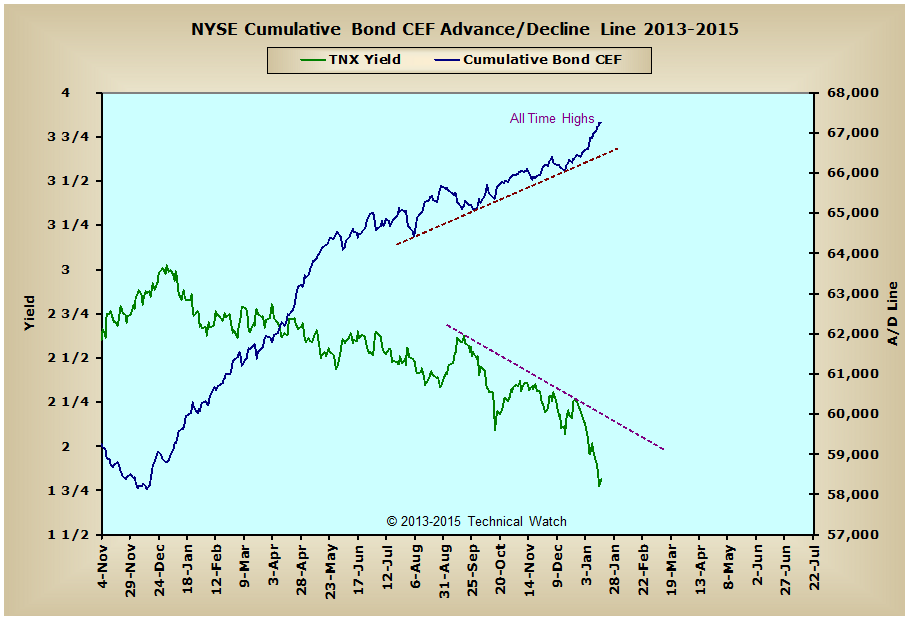
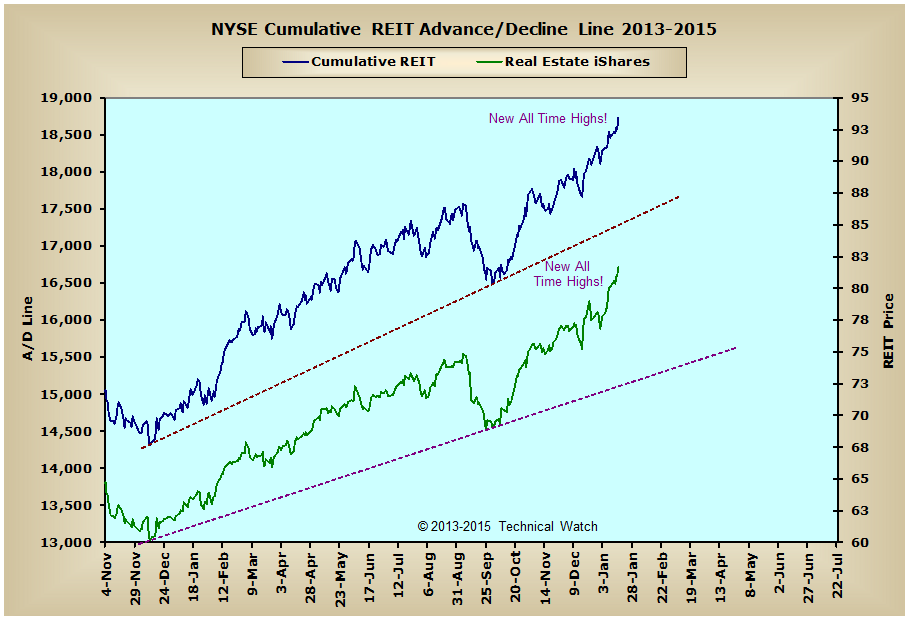
Looking at the breadth charts array for this week and we see that money flow remains quite buoyant in spite of the market's price gyrations with the NYSE Composite advance/decline line closing back in a bullish configuration above all three of its Trend models (the 19 day, 39 day and 200 day EMA's) at Friday's close (see cumulative charts). Meanwhile, after breaking below its rising bottoms line on Wednesday, the NYSE Common Only advance/decline line finished up Friday by snapping back to this same line with a positive breadth plurality of a little over 6:1, while the NYSE Specialty advance/decline line continued to find support at its rising trendline going back to the September lows of last year. In the all important interest rate sensitive issues, the NYSE Preferred and NYSE REITS advance/decline lines closed the week again at new all time highs, while the NYSE Bond CEF advance/decline line did the same on Thursday before there was a bit of profit taking on Friday. Speaking of interest rates, it should be duly noted that the downside target for the 10 year note given back in the October 24th review of 1.7% was also minimally met on Thursday with a close of 1.78% on a daily basis. However, with the NYSE Bond CEF A/D line continuing to see higher cumulative highs, a full on challenge of the May 2013 lows of 1.63% is now likely, with any break below this level creating a challenge of the all time lows of July 2012 at 1.40%.
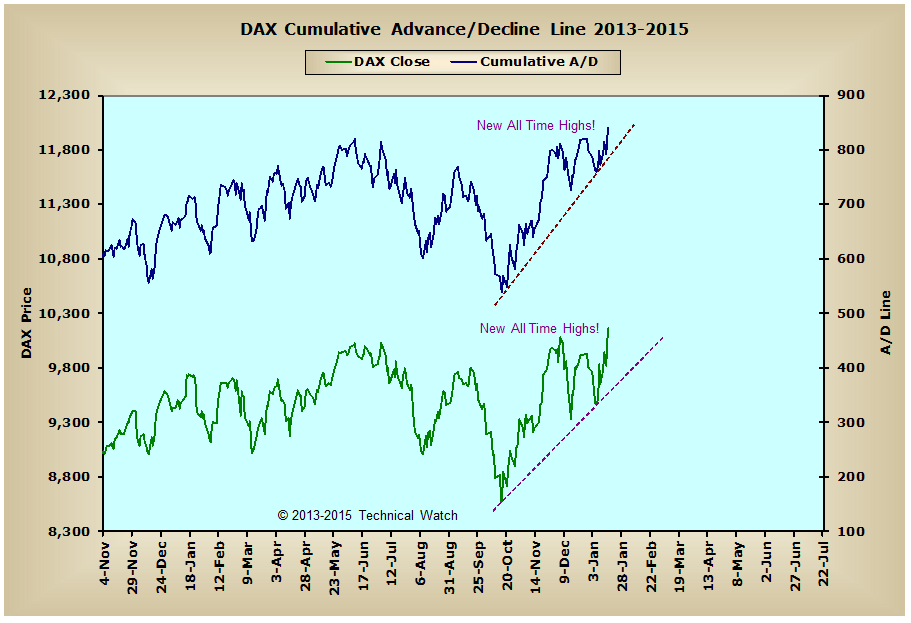
Over in Europe, both the DAX index and the DAX advance/decline line closed at new all time highs on Friday as money continues to look forward toward better earnings data to come out of Europe in the not too distant future. Much of this, of course, has to do with the crash in fuel costs and the continued race to provide negative interest rate returns on government issues. In fact, Germany's yield on their 2 year bond closed at a negative .156% yield on Friday and this probably had a heavy hand in why the Swiss decided to remove their minimum exchange rate with the Euro on Thursday. In any event, in a world where money is always looking for the best way to make more money, there seems to be no real competition in Europe right now on where to put it...equities.
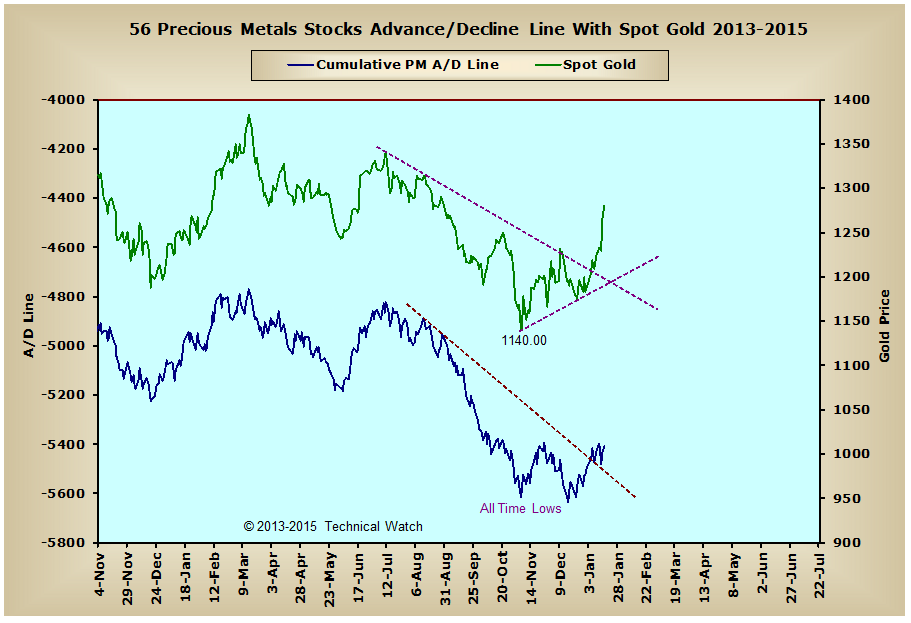
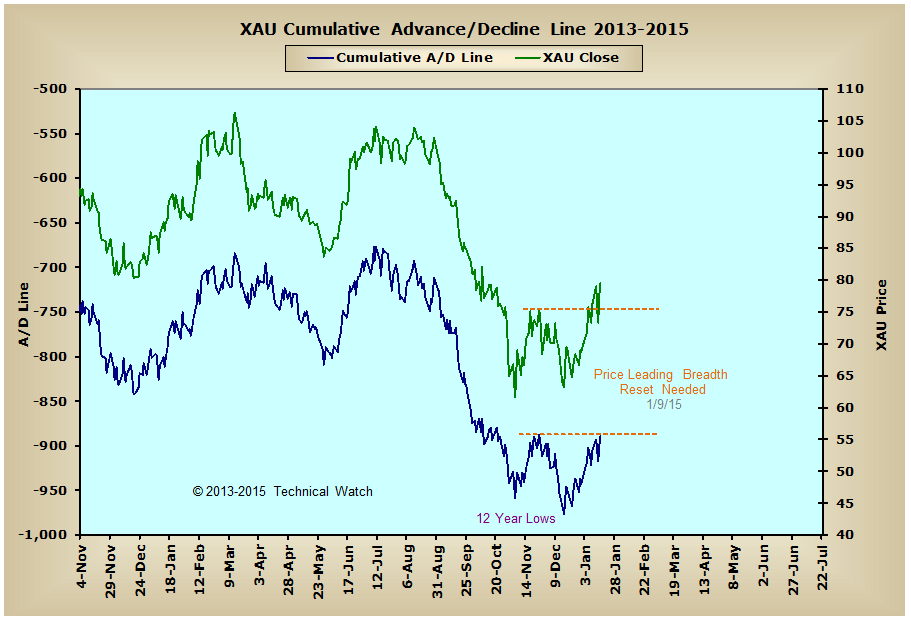
Speaking of the "Swiss Surprise", the price of gold rocketed higher on Thursday's news closing up another $56.90 (4.65%) for the week with the price of silver finally joining in on the party with a 7.65% gain of its own. Unfortunately for both, however, we still don't have any money flow leadership in both the Precious Metals or XAU advance/decline lines which makes current price levels rather risky to some sort of price reset in this asset class. Because of this, any long positions taken after we closed above the $1210 level two weeks ago should be prepared for some backing and filling to take place over the next several weeks in what should be another accumulation point as long as the A/D lines we follow here remain above their December lows.
So with prices continuing to be pulled back and forth like the proverbial tug of war, the intermediate term trend of money flow continues to hang in there quite nicely in spite of the sellers having their way of things on short term basis. With the BETS indicator remaining neutral, and with many of the breadth and volume McClellan Oscillators revisiting deeply "oversold" levels this past week, it would now appear that we're going to need a bit more time before any resemblance of an advancing price sequence is likely to take place as the market searches for harmony between buyers and sellers. For next week then, let's look for continued choppy and volatile market conditions within the large trading range noted in the New York Composite Index (see BETS chart) with the beginning of February providing the next window of opportunity to where a new trend to the upside can begin in earnest.
Have a great trading week!
US Equity Markets:
US Interest Rates:
US Real Estate:
Precious Metals:
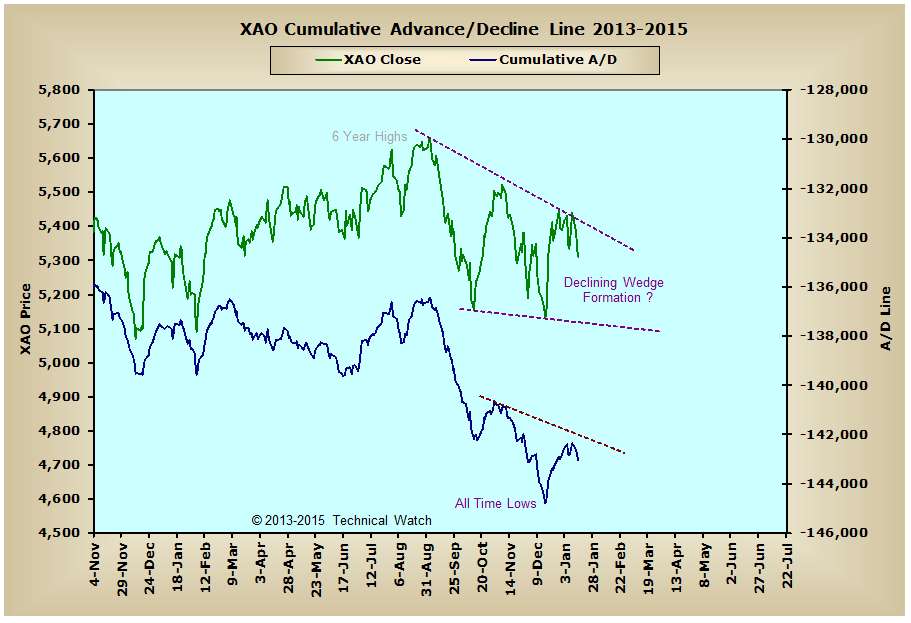
Australia:
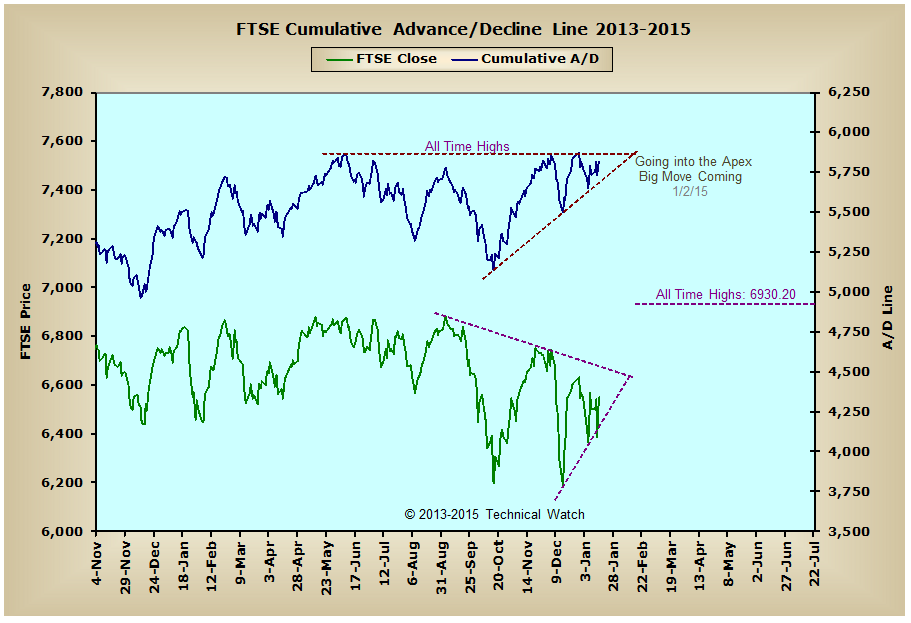
England:
Germany:
Technical Watch's Breadth Data Review includes a weekend recap of hard to find breadth measurements from the New York Composite Index, the London exchange (FTSE), the Frankfurt exchange (DAX) and Sydney's All Ordinaries index. Charts are provided with a market narrative by Dave Breslaw and are annotated for additional clarity and suggested positioning. Also included with this service are occasional special posts of longer term data charts to provide a comparable historical context of how internal action of the markets (money flow) can have a direct effect on the direction of price itself. This service works hand in hand with the Chatting the Market subscription service as it provides additional global money flow insights found nowhere else on the internet. More information on subscribing to either or both services can be found by clicking here.


