

Weekly Breadth Data, Week Ending January 30, 2015
In what was one of the more volatile monthly sessions in stock market history, and after being up an average of 1.49% the week before, the major market indices finished on Friday with another resounding thud with an average loss of 2.33%, week over week, and saddling the month of January with an average loss of 2.75% from December's monthly settlement.
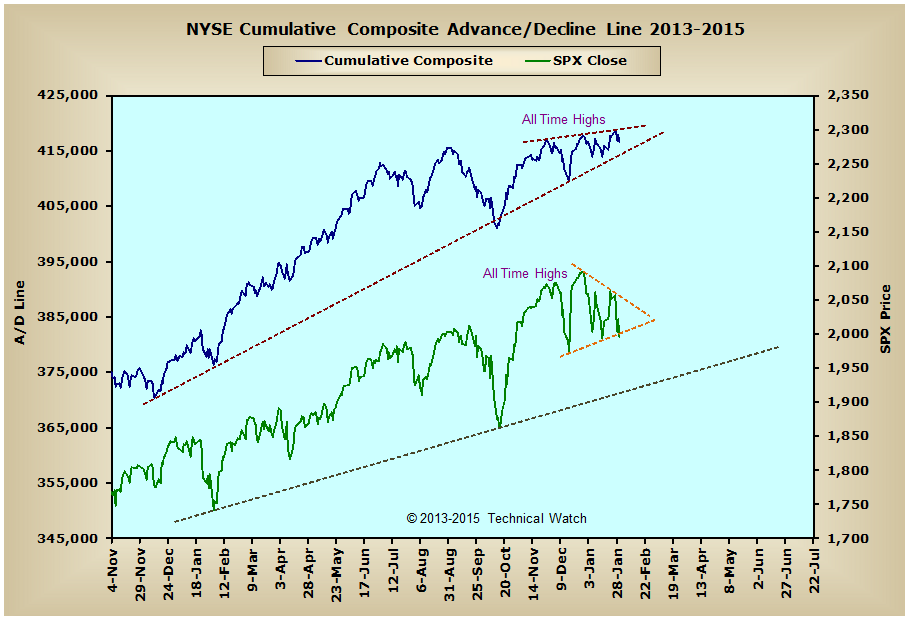
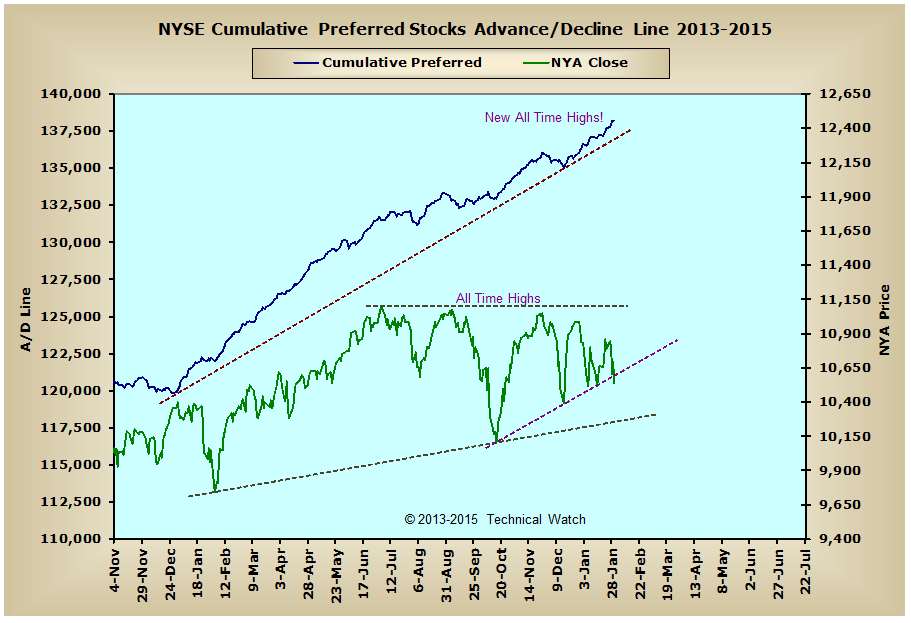
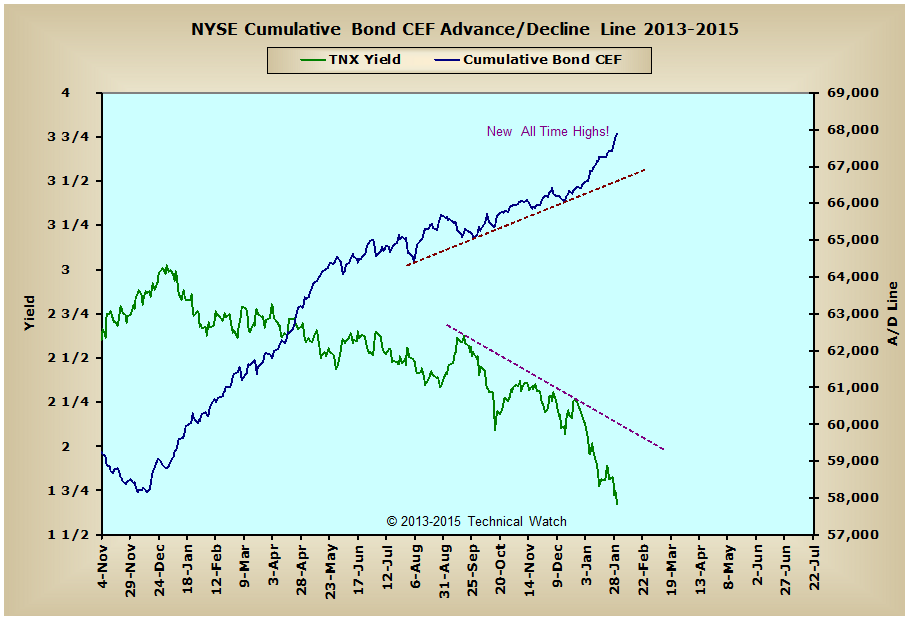
Looking at the breadth charts array for this week and we see that even with all the price volatility of the past month all of our money flow charts have either improved or have moved net sideways during this same time period. This would suggest that much of what is going on in the market right now is more cosmetic as it would be substantive to the intermediate to longer term direction of equity prices overall. The strongest area of the market continues to be with the interest rate sensitive issues as the NYSE Bond CEF and NYSE Preferred advance/decline lines once again closed at new all time highs for their eighth consecutive week. It's important to remember that when these two market derivatives see higher highs, not only does it tell us that interest rates will move in the opposite direction, but history has also shown that equity prices will play follow the leader to new highs of their own in the not too distant future.
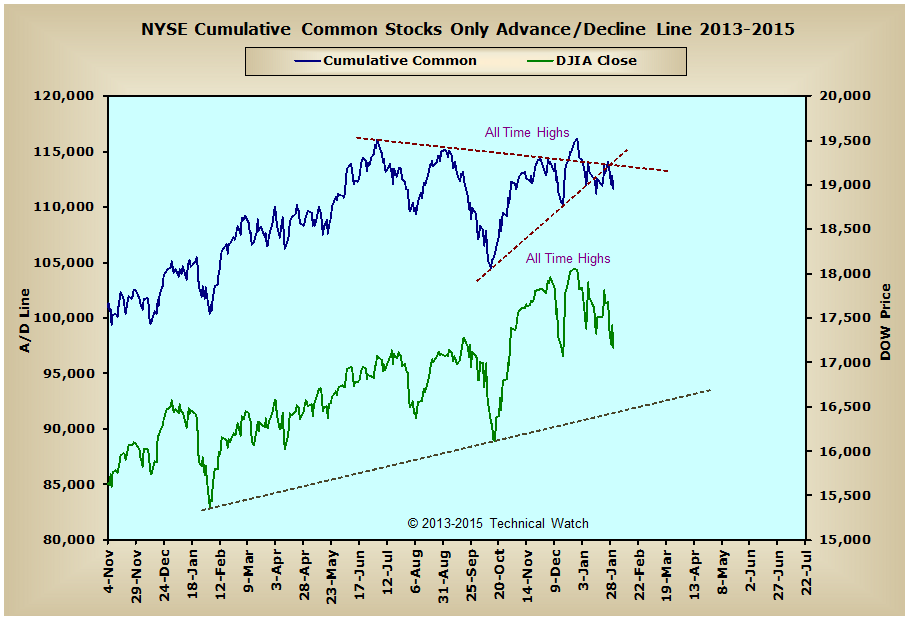
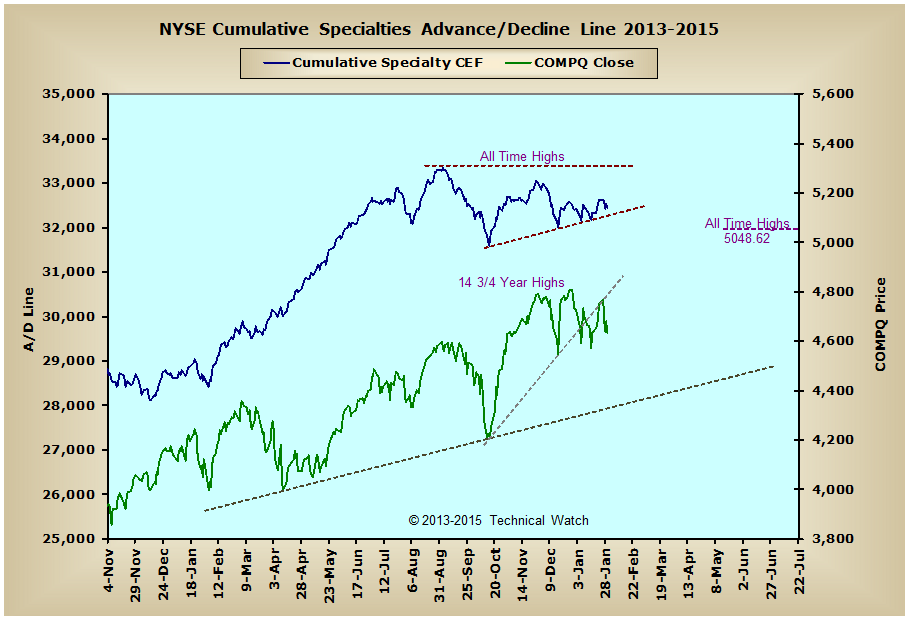
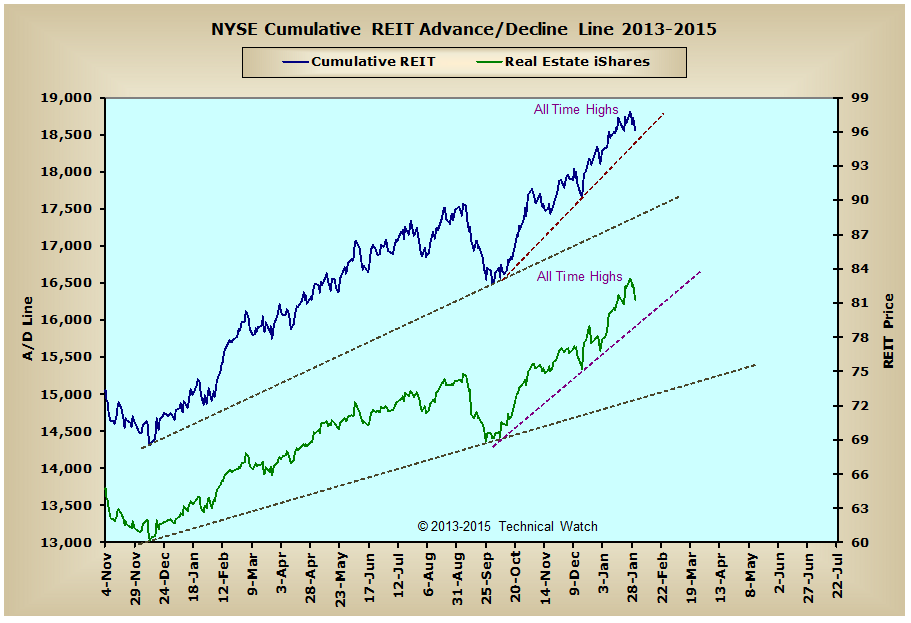
Meanwhile the NYSE Composite advance/decline line moved to another new all time high on Monday before settling the week 1931 net advancing issues from this same high point, while the NYSE REIT advance/decline line is only 247 net advancing issues from this same cumulative milestone. With the NYSE Common Only (4449) and NYSE Specialty CEF (918) advance/decline lines within a weeks worth of reaching these same high plateaus, any renewed strength that we may see over the next couple of weeks is sure to provide enough energy for all the market indices to see new historic price levels sometime in the month of February. Stay tuned.
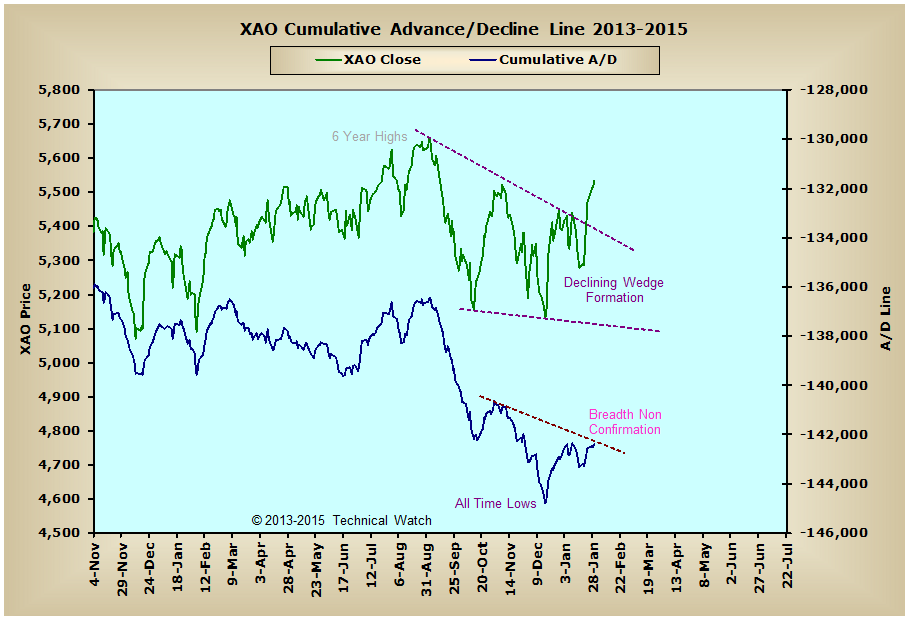
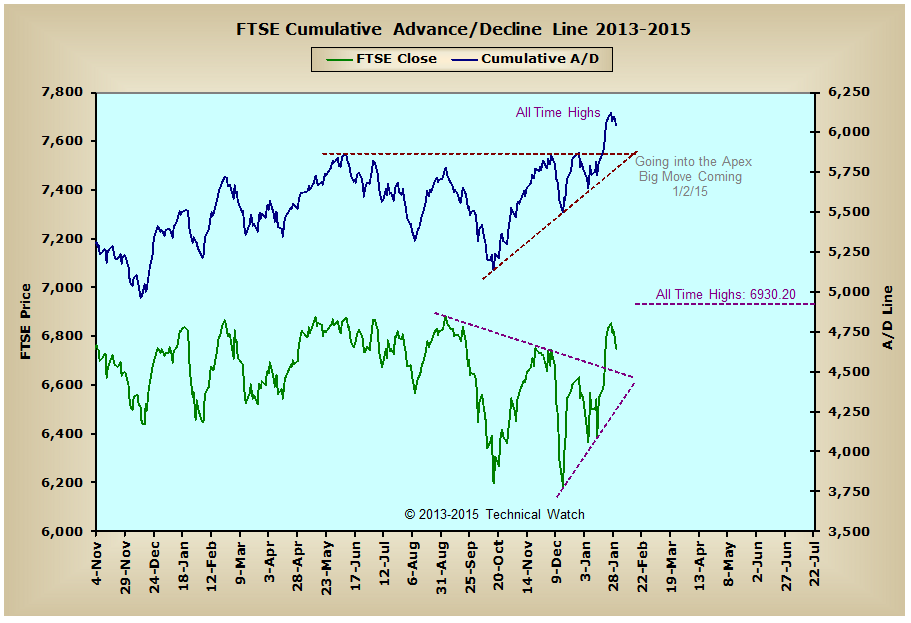
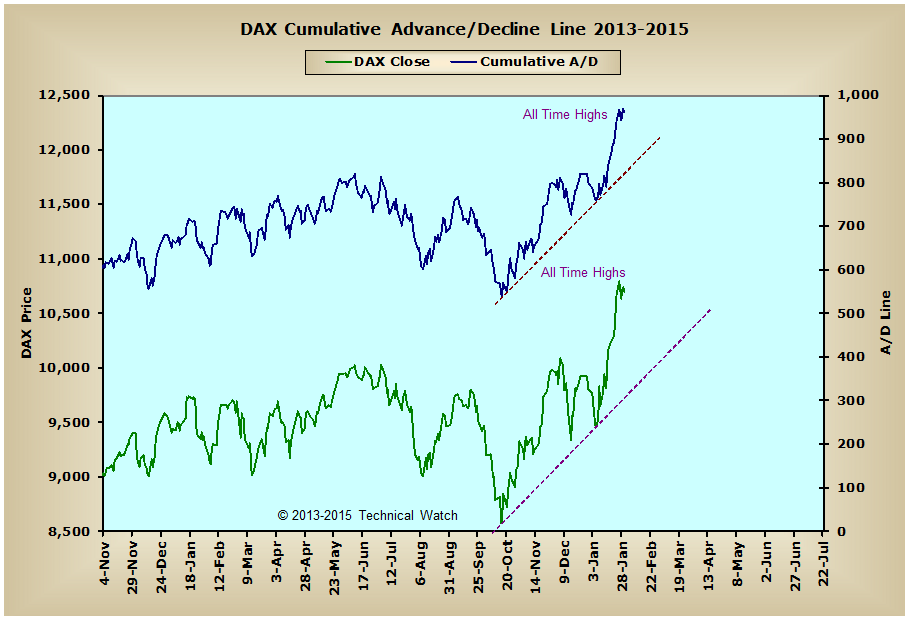
Looking over in Europe and we see that both the DAX and the FTSE advance/decline lines continue to see new all time highs in both exchanges over the last two weeks though, unlike the DAX index, the FTSE continues to have its challenges in moving above its all time price highs that were last seen back on December 31, 1999. But with both the European Central Bank and the Bank of England remaining with a highly accomodative monetary policy, it is our technical expectation that much of Europe's equity markets will continue to be buoyed by this stance as money continues to seek out areas that provide the greatest total return.
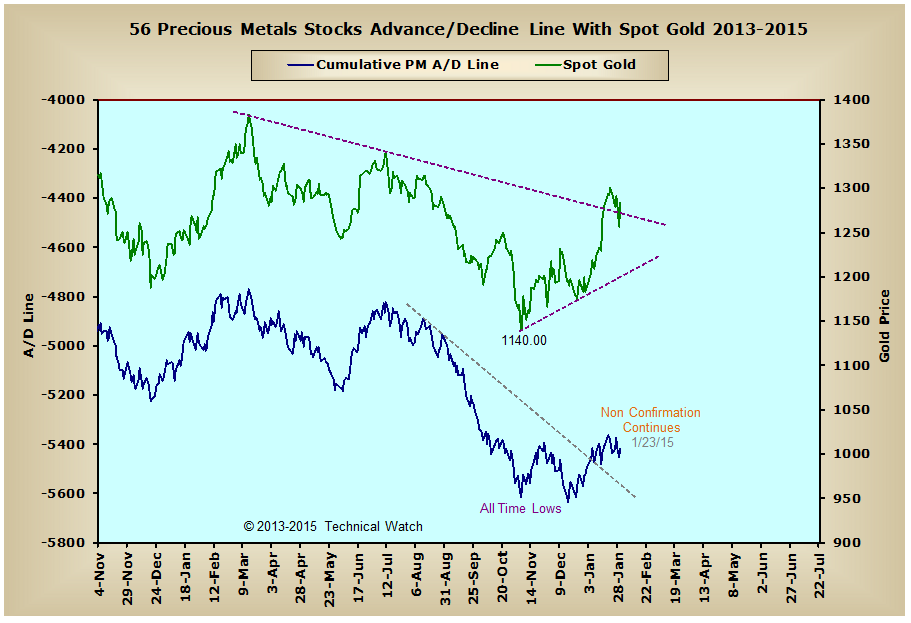
The precious metals asset class had a wild week of its own with gold settling down by only .80% as the breadth to price relationship that been out of sync over the last several weeks attempts to square itself to where a trending price structure can finally develop. At this point, however, we still see that it's going to take more than just a 2.80% two day shake out in the price of gold to accomplish this according to the Precious Metals advance/decline data, so let's take a more defensive posture toward this area of investment until we see a more substantive attempt by the buyers to push breadth back into a leadership role.
So although it's been a tough several weeks for both sides of the trade, the sellers eventually won out overall in pushing prices lower for the month. However, on a technical basis, we haven't seen much in the way of internal damage as to the longer term direction of the money flow lines that we follow in these weekly reviews. Because of this, and that the interest rate sensitive issues continue to show great promise for equities, along with many momentum analytical tools now showing divergences with the previous price lows we've seen during the month of January, it would now appear that we're getting close to some sort of tradable bottom if based on nothing else but the bearish market sentiment that's come to a somewhat fever pitch over this weekend. Taking that then, and then including the NYSE TRIN registering a deeply "oversold" 3.61 reading on Wednesday, all of this evidence suggests that next week could indeed provide the turning point we've been looking for from where we will see higher equity prices (from current levels) in all of the major market indices by this time next month.
Have a great trading week!
US Equity Markets:
US Interest Rates:
US Real Estate:
Precious Metals:
Australia:
England:
Germany:
Technical Watch's Breadth Data Review includes a weekend recap of hard to find breadth measurements from the New York Composite Index, the London exchange (FTSE), the Frankfurt exchange (DAX) and Sydney's All Ordinaries index. Charts are provided with a market narrative by Dave Breslaw and are annotated for additional clarity and suggested positioning. Also included with this service are occasional special posts of longer term data charts to provide a comparable historical context of how internal action of the markets (money flow) can have a direct effect on the direction of price itself. This service works hand in hand with the Chatting the Market subscription service as it provides additional global money flow insights found nowhere else on the internet. More information on subscribing to either or both services can be found by clicking here.


