http://www.traders-t...?...=158556&hl=
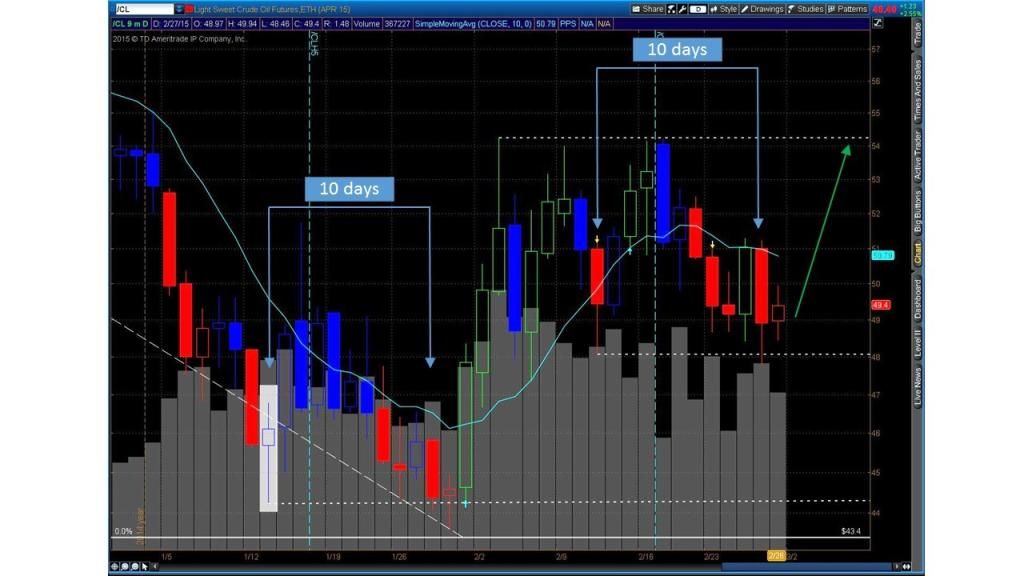
I am seeing a similar reversal pattern in oil setting up for Monday. As shown in the chart, the first test of the Jan. 13 low on low volume occurred 10 trading days later. Oil made a secondary low on Feb. 11 that was tested 10 days later on lower volume. That test occurred last Thursday. On Friday, oil formed a small body candle (doji) similar to the candle on Jan. 29. That pattern preceded a blast off in oil price on Jan. 30 which saw oil rally $10 in 3 days. If that pattern repeats, we should see a similar blast off in oil price starting on Monday.
Other than a position in MLPL, I am flat oil going into Monday. However, I will be a buyer of oil stocks in a big way, on any strength in oil prices on Monday. If resistance at the upper end of the trading range at $54 is broken, then I see oil going to $58-59, which is the 23.6% retracement of the decline in oil from the 2014 top.


