

Weekly Breadth Data, Week Ending February 20, 2015
It was another constructive week for the bulls as last week's forecast turned out to be pretty much on target with the major market indices finishing on Friday with an average gain of .76%, week over week, led by the NASDAQ Composite Index which is now less than 93 points from joining the great majority of the other US indices at new all time highs.
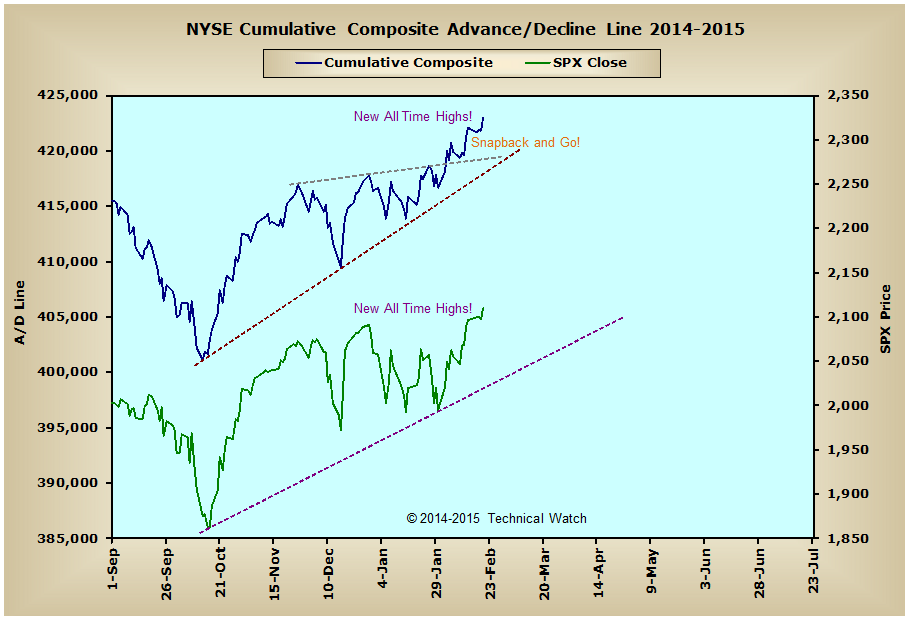
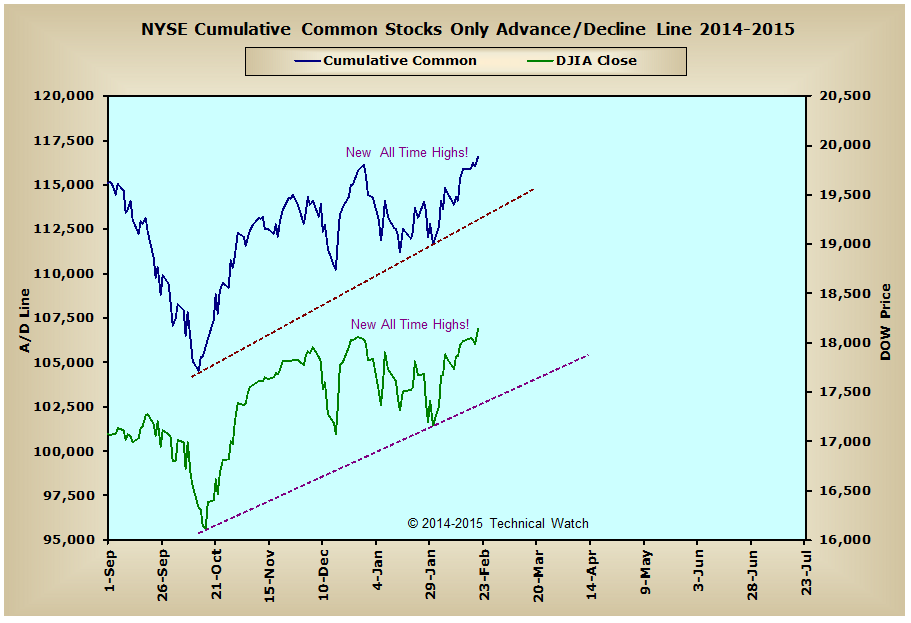
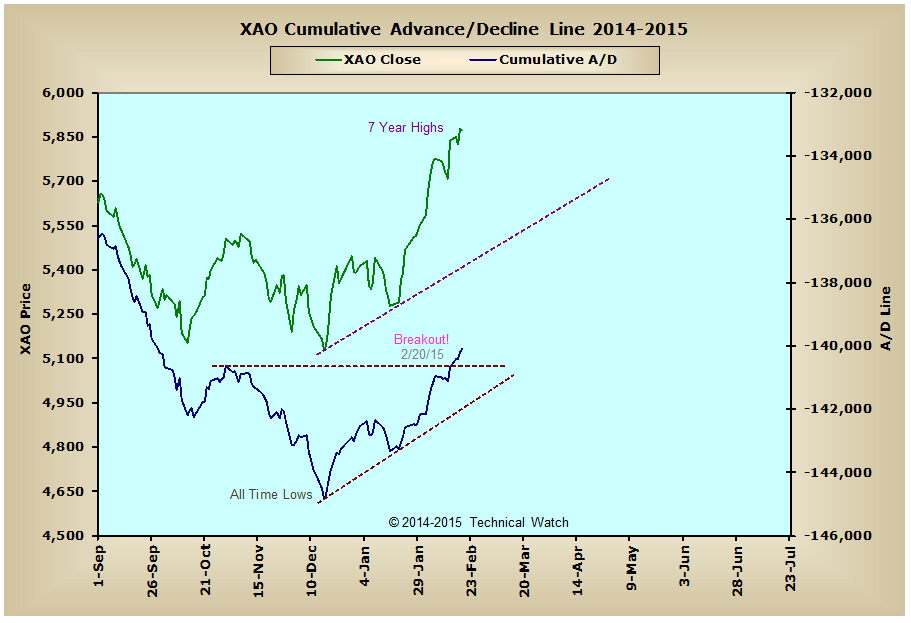
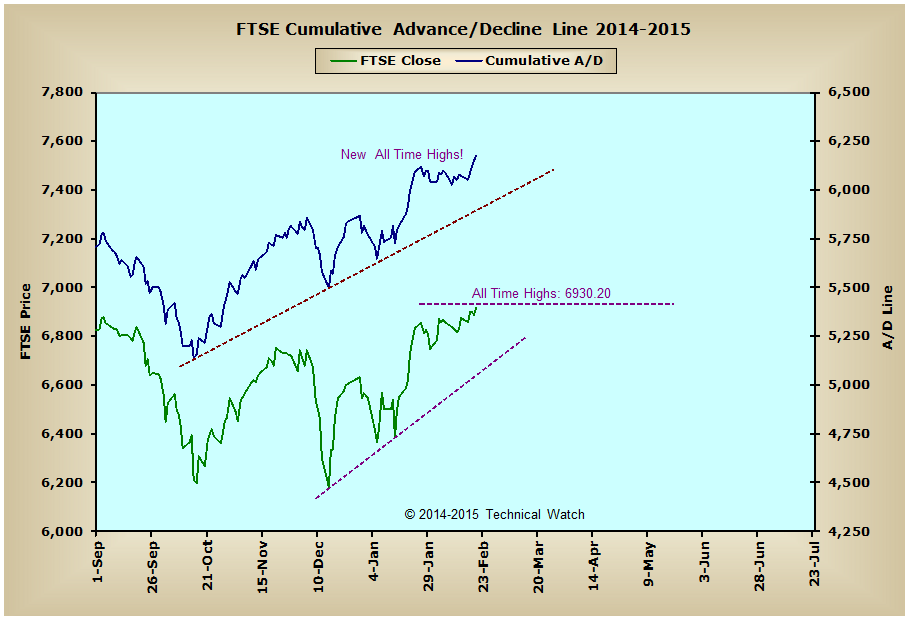
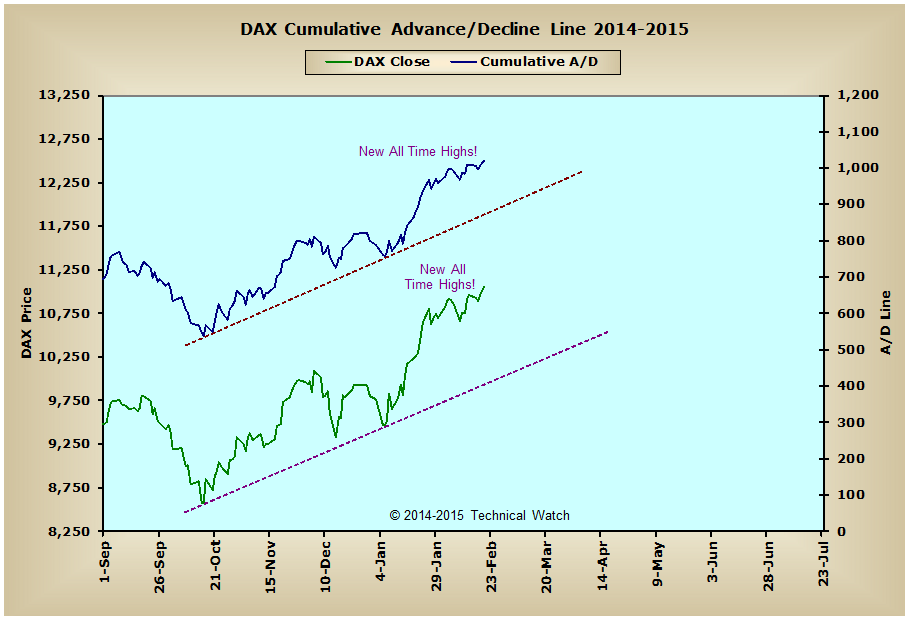
Looking at the breadth charts array for this week shows continued strength in the flow of money moving into the equity markets as the NYSE Common Only finally joined the NYSE Composite advance/decline line in new all time high territory. This same strength in buying also showed up in Europe as both the DAX and FTSE advance/decline lines closed the week at new all time highs of their own with England's FTSE index now only 15 points away from joining the DAX at new historic highs. Even the Aussie advance/decline line showed breakout strength this past week as it was finally able to move above it's early November highs. All in all then, the equity markets that we cover here each week continue to find solid bids below current levels and this should continue for the next several weeks.
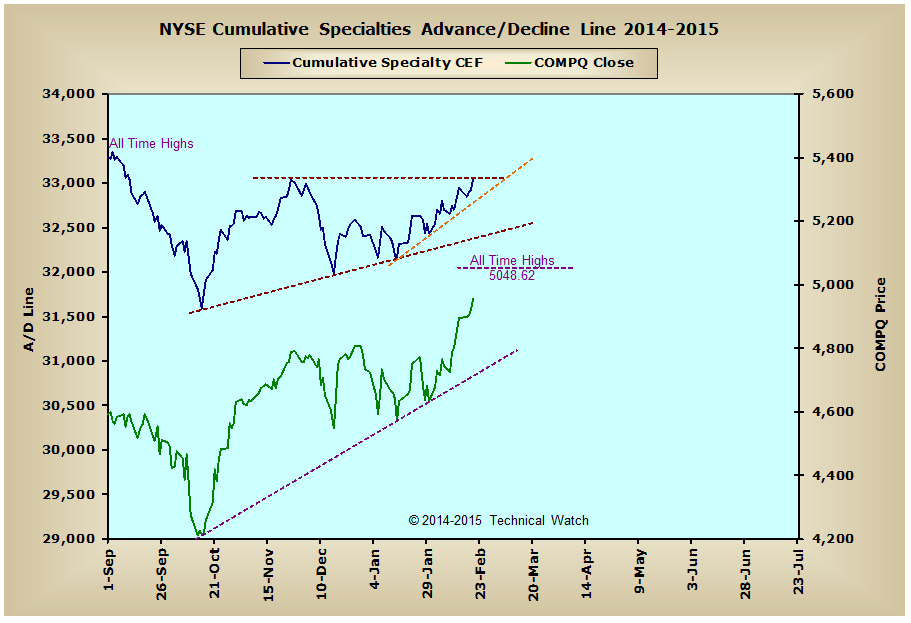
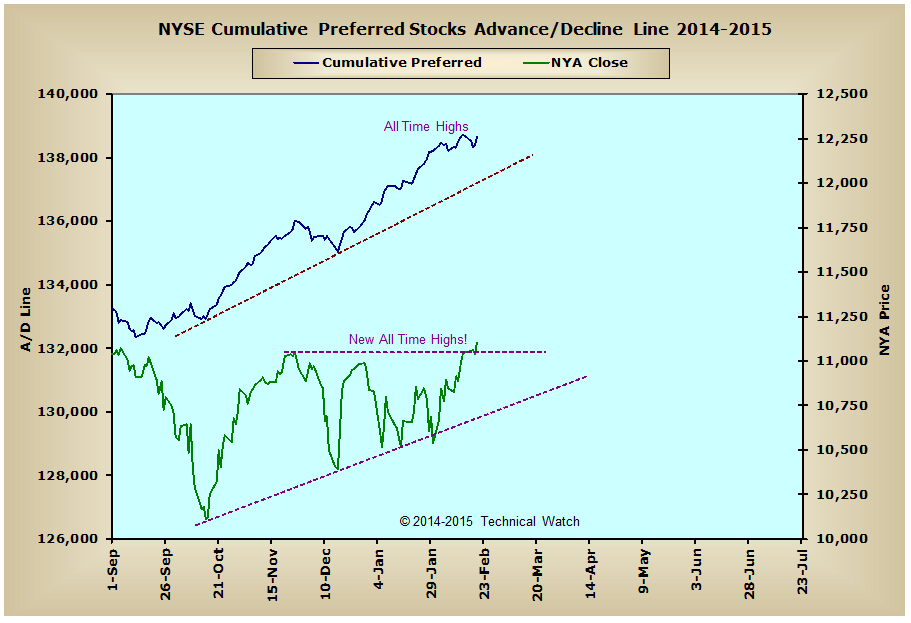
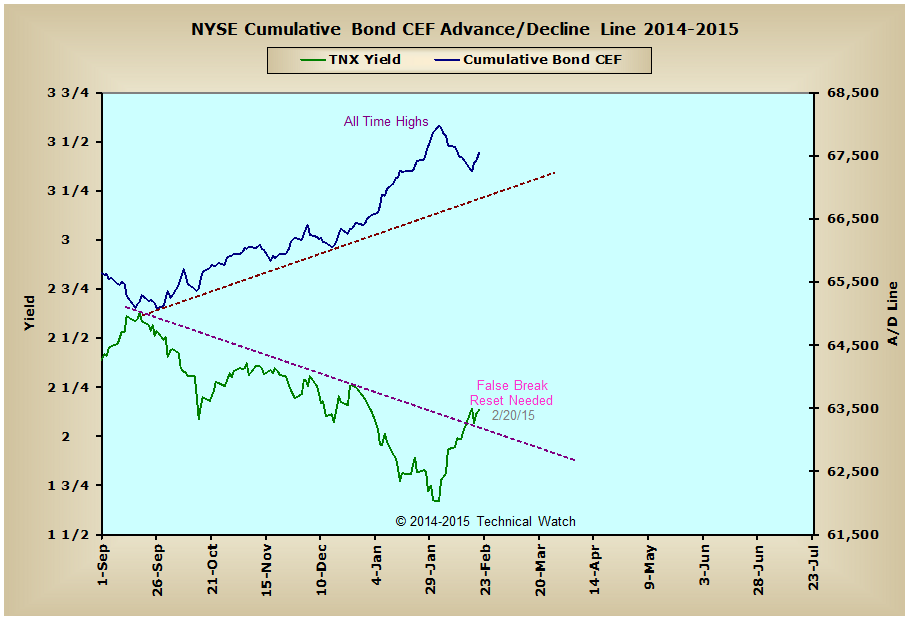
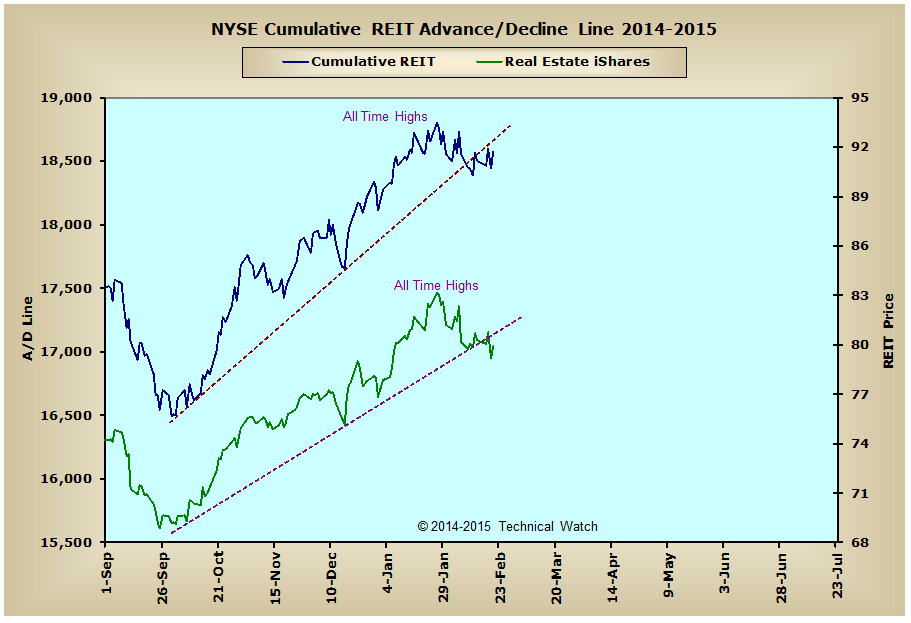
Over in the interest rate sensitive issues, we see that the NYSE Specialty CEF, NYSE Preferred, NYSE REIT and NYSE Bond CEF advance/decline lines all remained buoyant during last weeks "pause to refresh" with the specialty group now up against its first line of resistance. With the bond CEF group continuing to show more profit taking than it would be considered all out selling in its pattern structure, the expectation remains that interest rates will find pattern resistance between the 2% and 2.25% level on the 10 year note, and that a technical challenge of this month's lows in yields should still not be ruled out. In any event, the corrective sell off in the debt class is probably very close to running its course, so it wouldn't be too surprising if the yield on the 10 year note is back below 2% in the next couple of weeks.
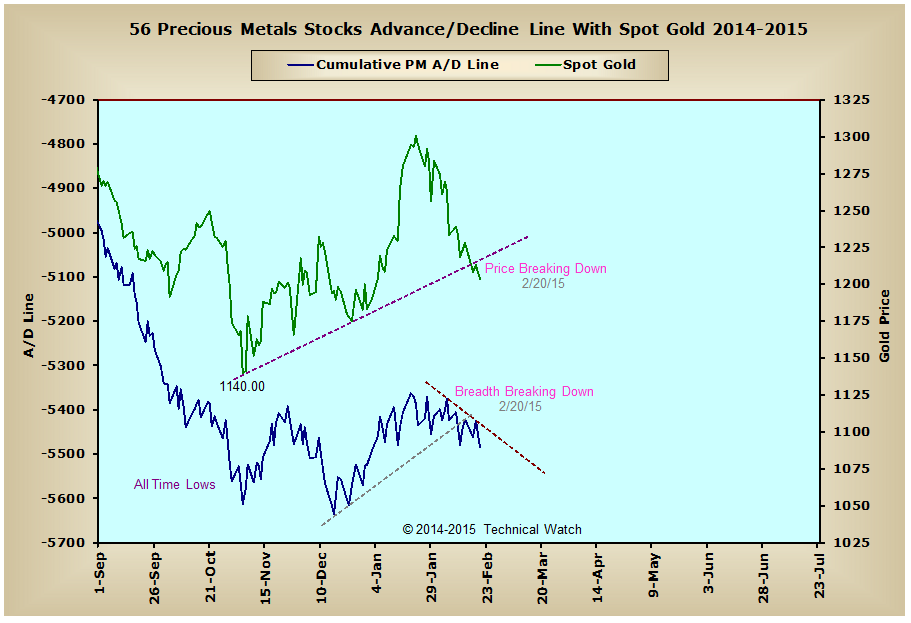
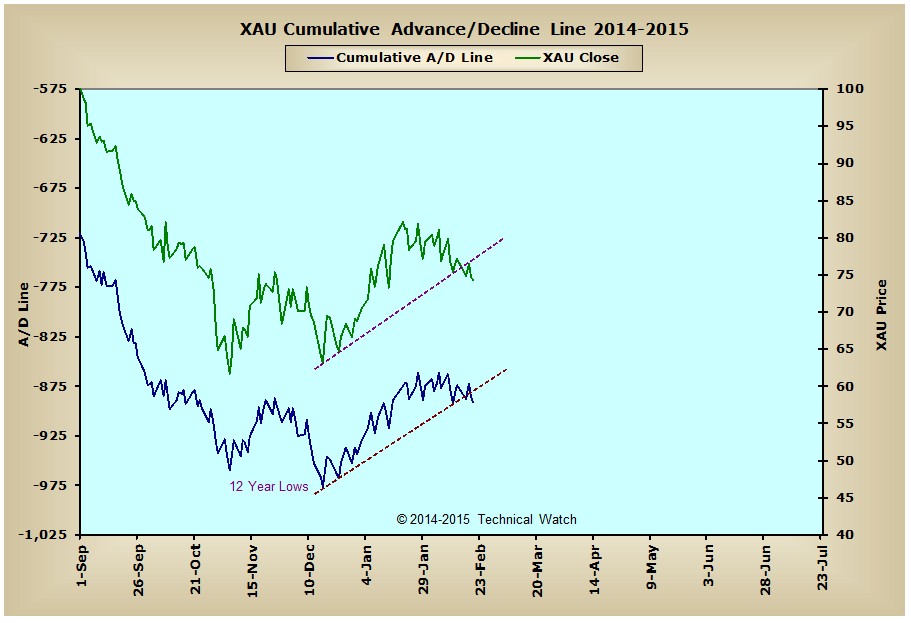
Over in the precious metals complex the price of gold and silver both continued to weaken, and because of this, we're now seeing pattern breakdowns in both the Precious Metals and XAU advance/decline lines. With sentiment in this asset class remaining quite bullish even after losing close to $100 an ounce in the price of gold since its mid January peak, and the chart patterns of both gold and silver moving back into bearish configurations, lets continue to maintain our defensive posture in this asset class next week and see if the buyers finally step in to save what's ever left of the early January rally or if they finally give up altogether and we challenge the December lows.
So although the intermediate trend of money flow remains highly positive, we also note that this week's BETS (+35) was not able to move above its trendline resistance in this effort. This then presents a near term problem in providing internal confirmation of the New York Composite Index' closing at new all time price highs on Friday. Looking around at the breadth and volume McClellan Oscillator's that we review in our chat sessions, and we see that Friday's price rally was also not confirmed by this indicator leading prices to their all time closing highs. Because of this, it will be important for the buyers to step in quickly on Monday to provide these missing confirmations, for if they don't, we'll likely see a false start "trip and stumble" reset next week in preparation toward, what should be, the development of a more aggressive advancing price sequence for the first half of March.
Have a great trading week!
US Equity Markets:
US Interest Rates:
US Real Estate:
Precious Metals:
Australia:
England:
Germany:
Technical Watch's Breadth Data Review includes a weekend recap of hard to find breadth measurements from the New York Composite Index, the London exchange (FTSE), the Frankfurt exchange (DAX) and Sydney's All Ordinaries index. Charts are provided with a market narrative by Dave Breslaw and are annotated for additional clarity and suggested positioning. Also included with this service are occasional special posts of longer term data charts to provide a comparable historical context of how internal action of the markets (money flow) can have a direct effect on the direction of price itself. This service works hand in hand with the Chatting the Market subscription service as it provides additional global money flow insights found nowhere else on the internet. More information on subscribing to either or both services can be found by clicking here.


