

Weekly Breadth Data, Week Ending February 27, 2015
After rallying sharply for the first three weeks of February, the market digested those gains last week and ended up with a slight average loss of .18% from the close seen from the previous Friday. For the month of February then, the major market indices had one of its better months in history with an average gain of 5.68% with the NASDAQ Composite, now within 85 points of its all time highs, leading the way with a gain of 7.08%.
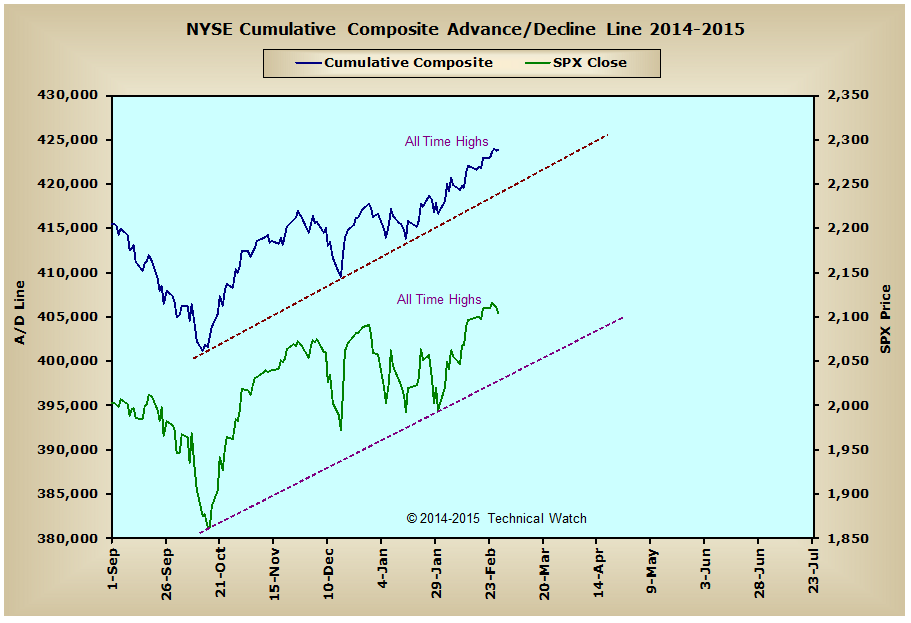
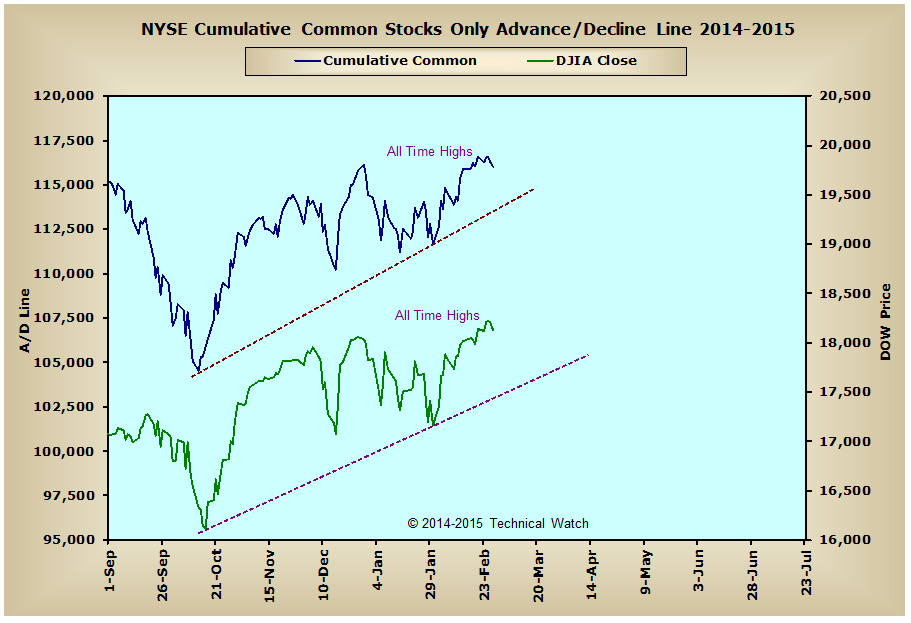
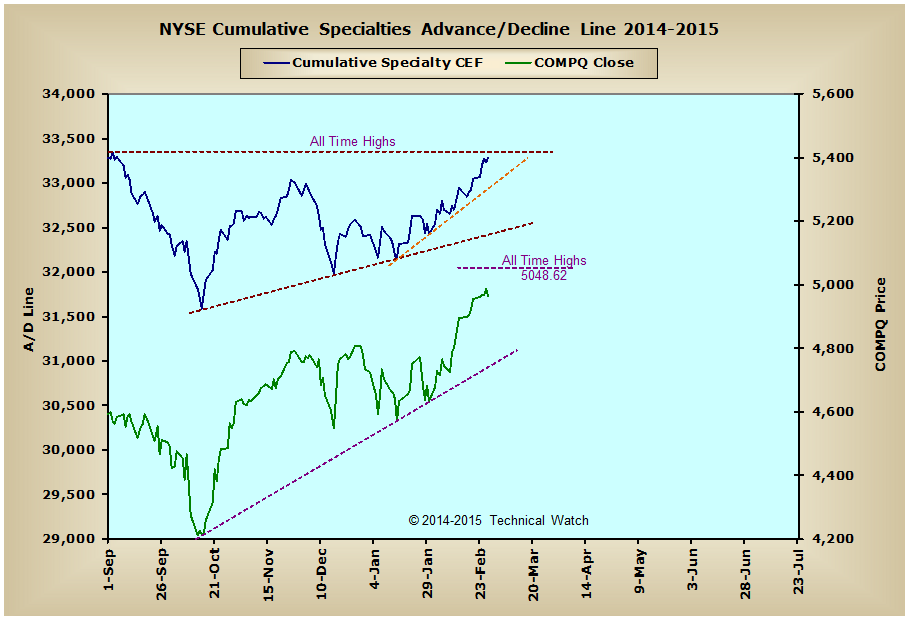
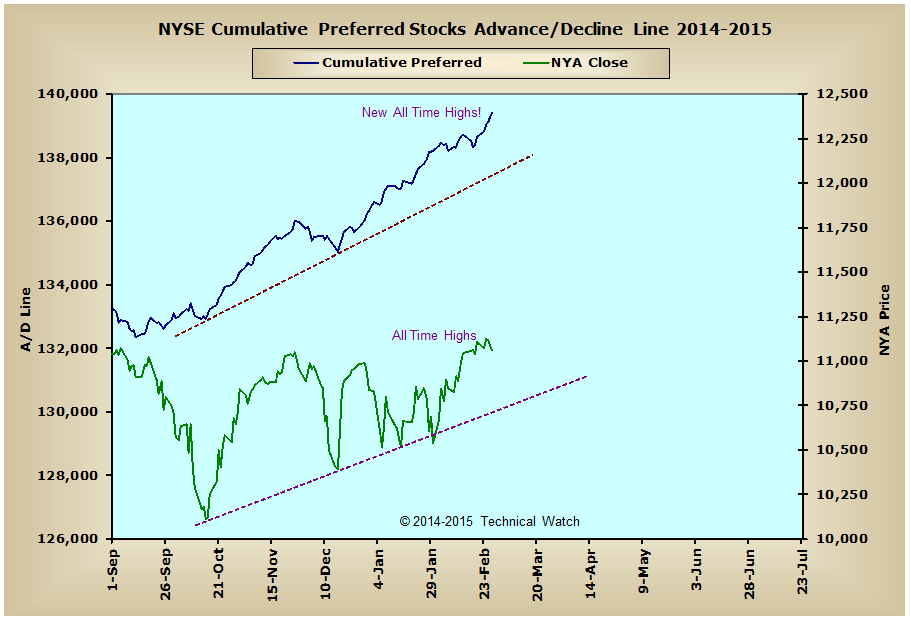
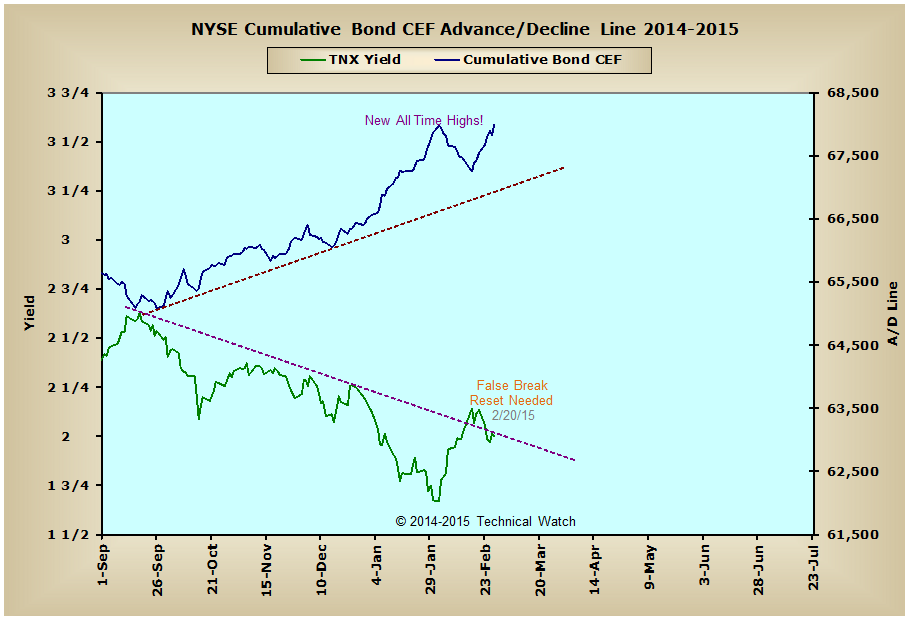
Looking at the breadth charts array for this week shows that both the NYSE Composite and NYSE Common Only advance/decline lines both moved to new all time highs on Wednesday before finishing the week just below these record levels. Meanwhile, the NYSE Preferred and NYSE Bond CEF advance/decline lines both closed at new all time highs on Friday while the NYSE Specialty CEF advance/decline line continued to build good cumulative gains...settling the week just 65 net advancing issues from moving back into new historic levels of its own. It's very important to remember that as long as these interest rate sensitive breadth derivatives continue to make higher highs, not only does this tell us that interest rates will remain low, but this promises us that equity prices will follow suit in the not too distant future.
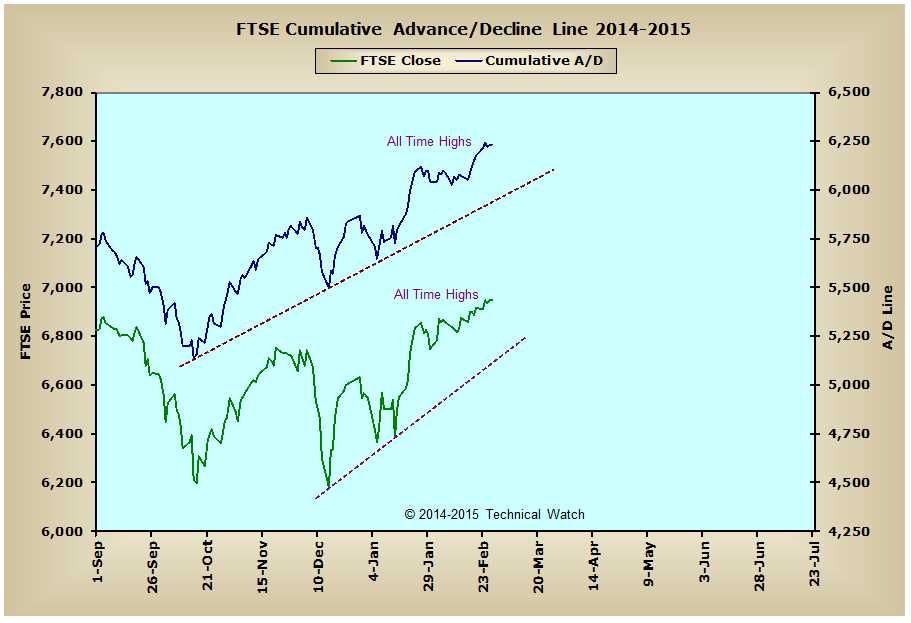
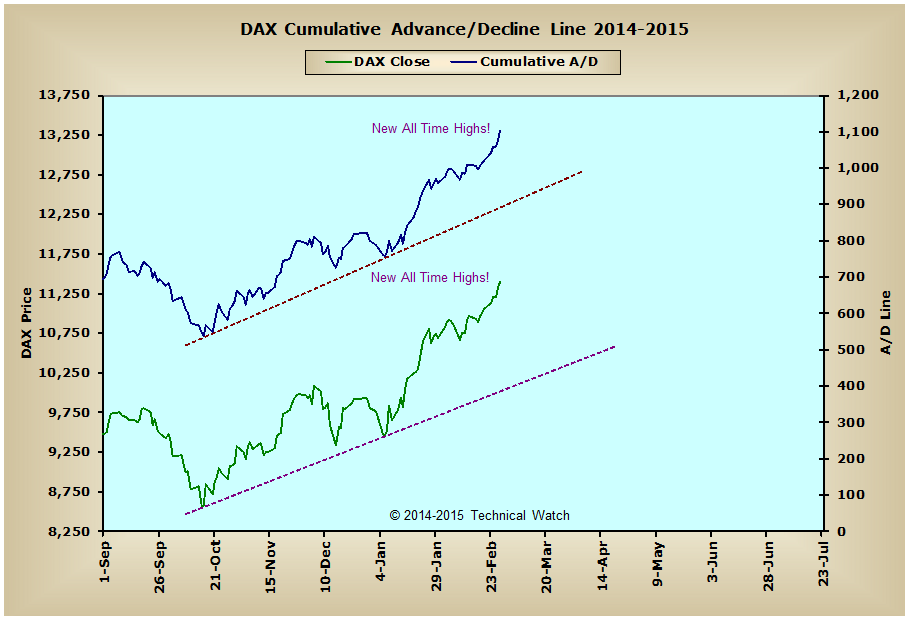
The good news also continues over in Europe as both the DAX and FTSE advance/decline lines continued their climbs to levels not seen in their histories. The DAX, in particular, is seeing money flow literally overwhelming sellers right now as the index itself tacked on another 3.18% for the week, and 6.61% for the month, while the FTSE finally closed at new all time record price levels on Thursday capping off a monthly gain of 2.92%. Taken together, this tell us that liquidity levels in Europe are more than ample to cushion any seen or unforeseen economic blows that might pop up at the current time, and that we should see this liquidity quotient spread out to other equity markets in Europe over the next several weeks.
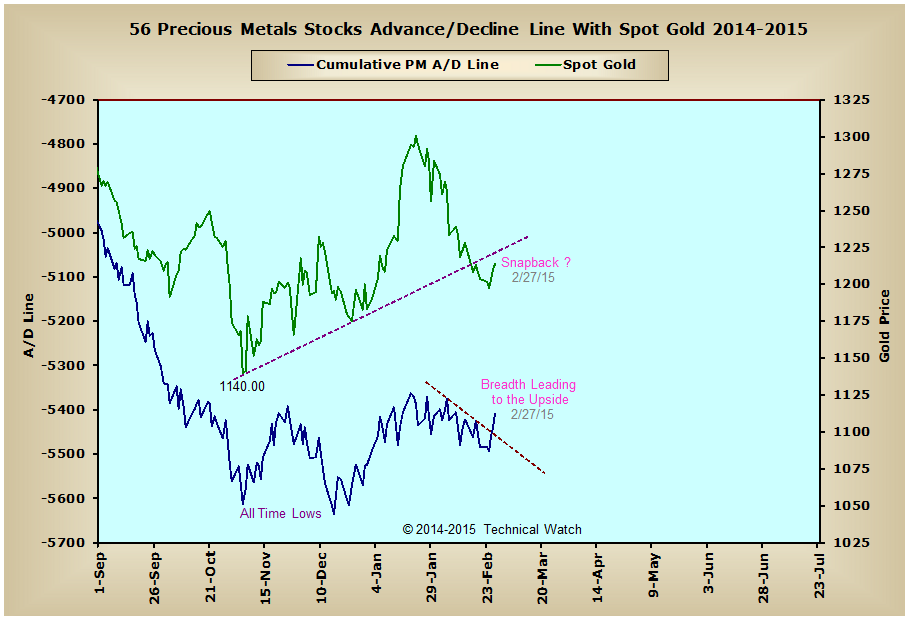
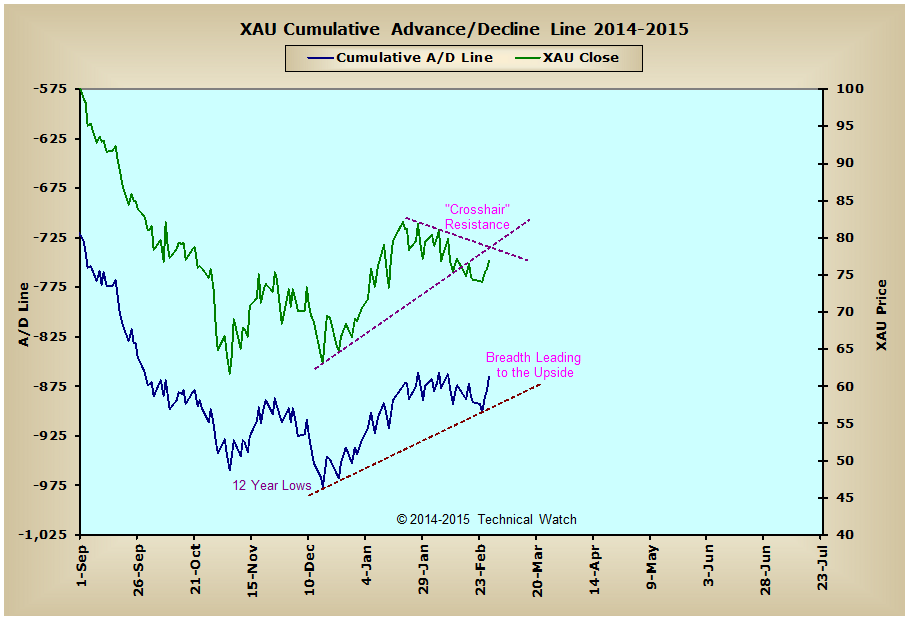
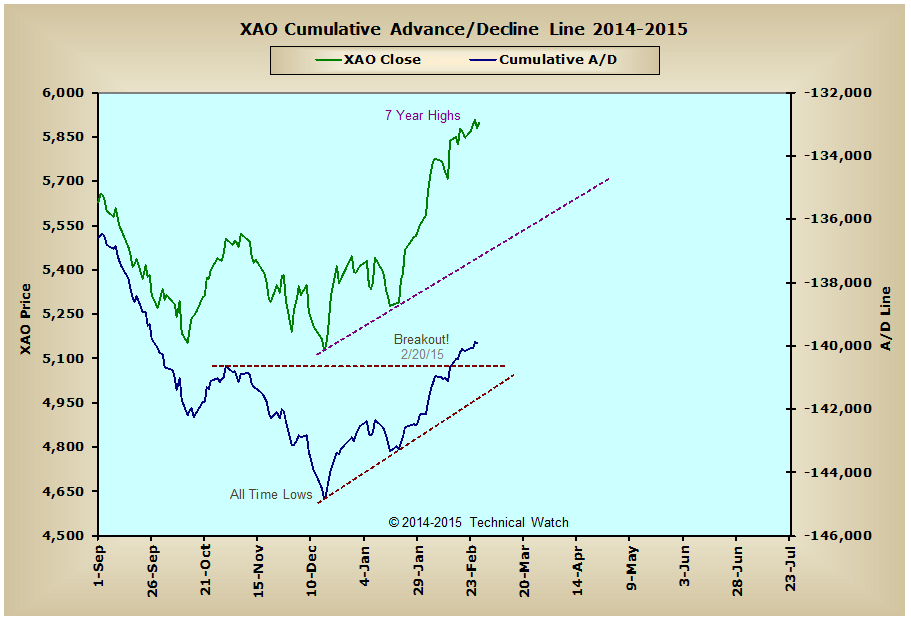
With all that said, however, the real exciting news for this week lies with the metal's markets as both the Precious Metals and XAU advance/decline lines had a constructive week as they found support and have now taken more of a leadership role over price to the upside. If we can now see this continue next week to where both of these money flow lines actually move above their January highs, that would be our trigger that our long expected tradable low has finally come, and we can begin to look at long positions in this sector for the first time since our sell signal back in the summer of 2012.
So with the month of February behind us, and our January expectation of new price highs in the markets now passed, we look forward to the month of March with great anticipation. Although a good internal foundation has been laid in this rallying process, it will now be up to the buyers to actually build on this to move above current levels in what is expected to be another banner month for stocks in general. Without this follow through, and all we can expect from here is maybe another 2 weeks of firm to higher prices before a more extended consolidation begins moving into April. In the meantime, let's take our clues from the BETS indicator (see cumulative charts) that has now moved sideways for the last 4 weeks with a +35 "accumulation" signal and is now right at its declining tops line that's been controlling the pattern since the June price highs of last year. Any break above this line of resistance would then clear the way to see new all time high closes in many, if not all, of the major market indices that trade here in the United States. Any failure to do so, and the trading range seen in the New York Composite Index on this same BETS chart will likely continue moving into quarterly OPEX on March the 20th.
In any event, the beginning of March is likely to live up to its axiom of a roar of a lion, but whether it will leave as that of a lamb or not is still yet to be determined.
Have a great trading week!
US Equity Markets:
US Interest Rates:
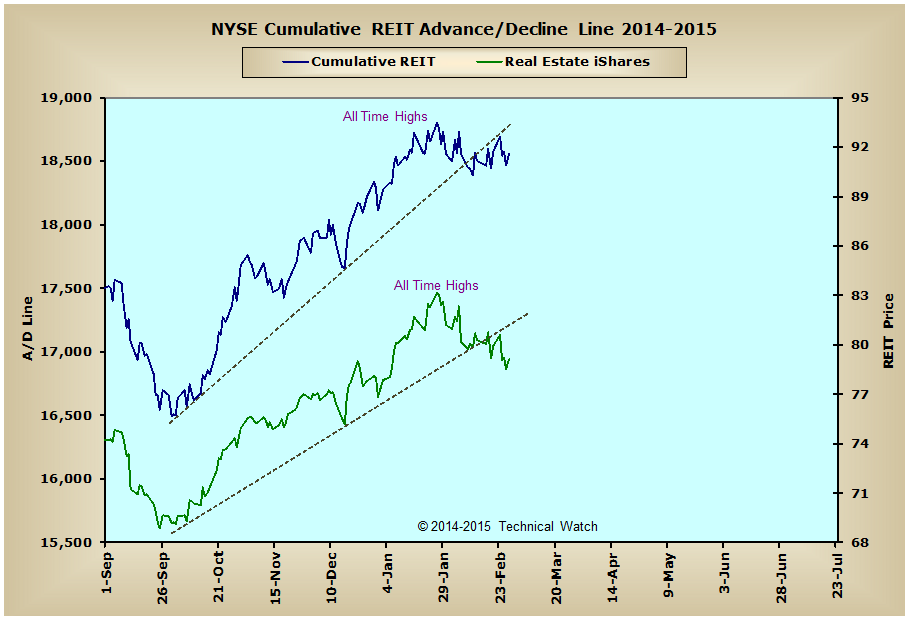
US Real Estate:
Precious Metals:
Australia:
England:
Germany:
Technical Watch's Breadth Data Review includes a weekend recap of hard to find breadth measurements from the New York Composite Index, the London exchange (FTSE), the Frankfurt exchange (DAX) and Sydney's All Ordinaries index. Charts are provided with a market narrative by Dave Breslaw and are annotated for additional clarity and suggested positioning. Also included with this service are occasional special posts of longer term data charts to provide a comparable historical context of how internal action of the markets (money flow) can have a direct effect on the direction of price itself. This service works hand in hand with the Chatting the Market subscription service as it provides additional global money flow insights found nowhere else on the internet. More information on subscribing to either or both services can be found by clicking here.


