

Weekly Breadth Data, Week Ending March 13, 2015
After a failed rally attempt on Monday, followed by a capitulation day on Tuesday, the rest of the week turned out to be pretty much mixed as the major market indices closed down an average of .28%, week over week, with the S&P 600 small cap index moving higher by 1.44%, while the large cap S&P 500 was down by only .86%.
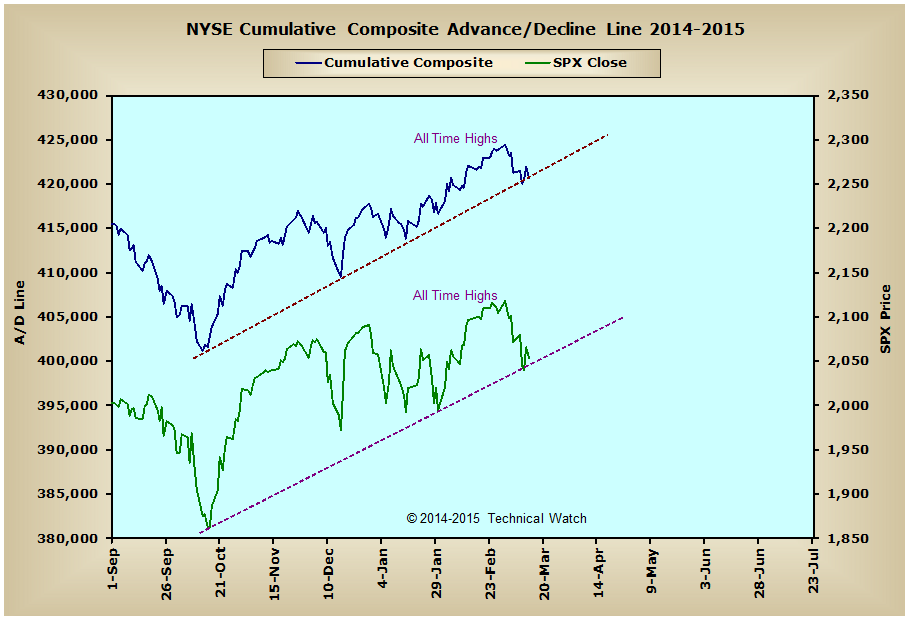
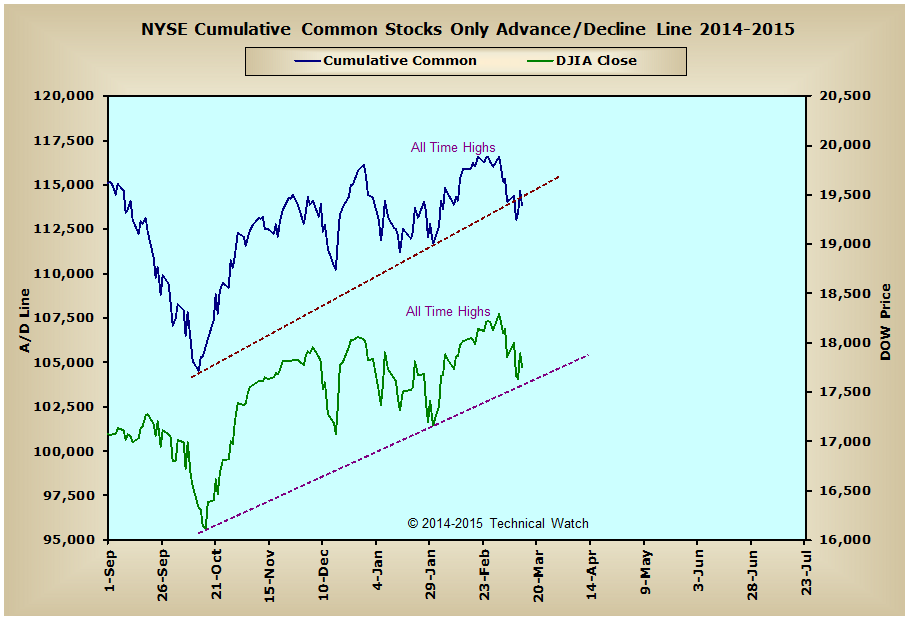
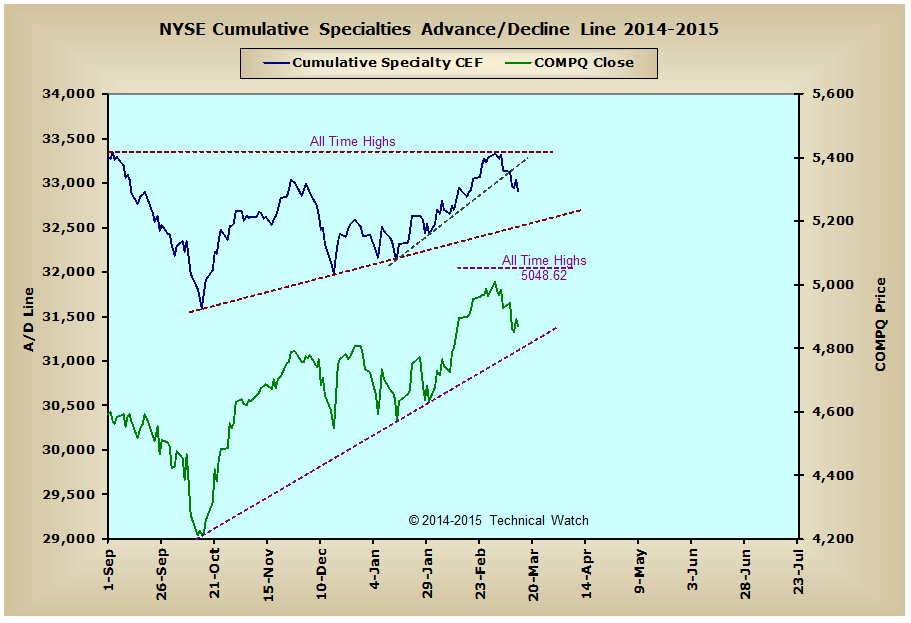
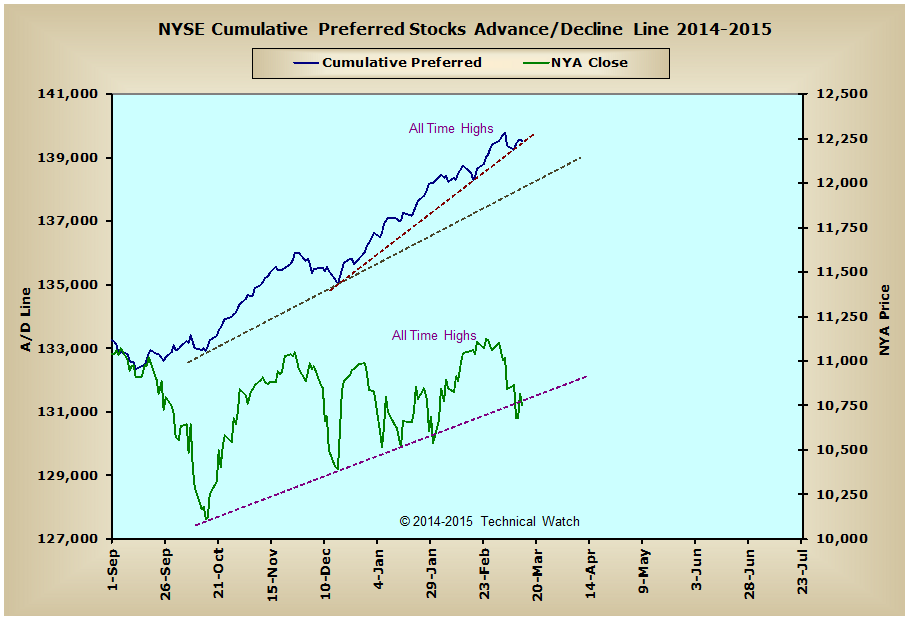
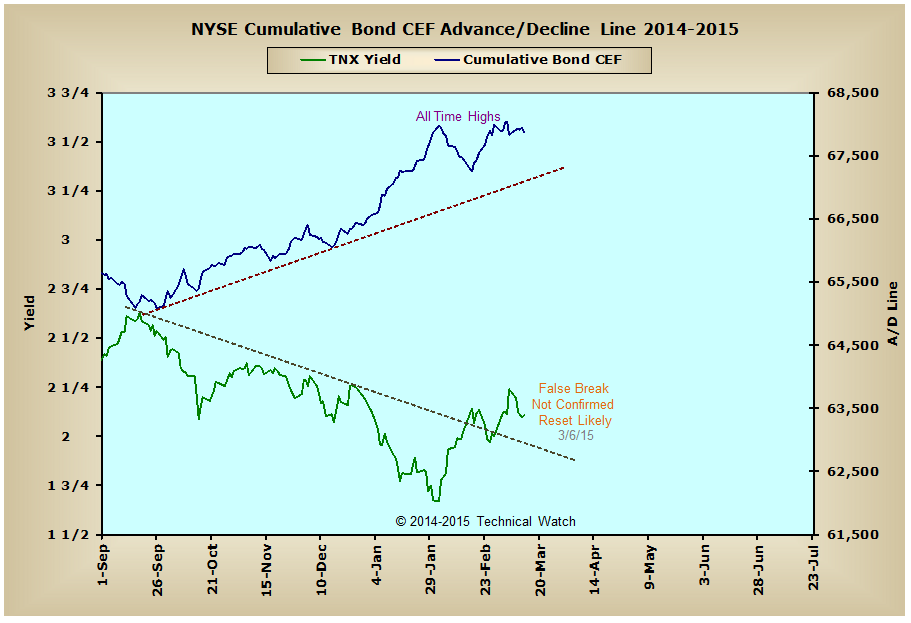
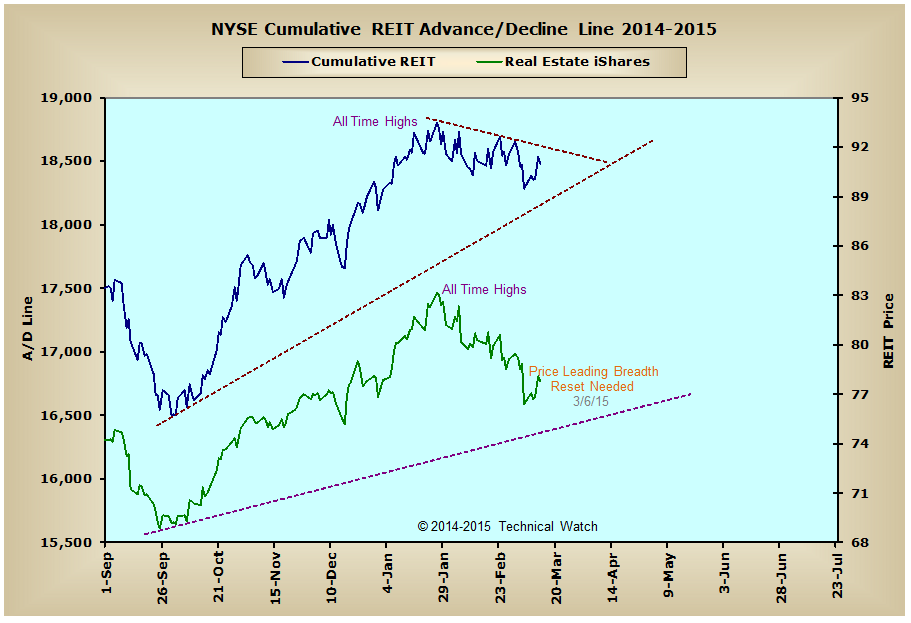
Looking over the NYSE breadth charts array for this week shows that while the NYSE Composite and NYSE Preferred advance/decline lines were finding good support at their intermediate term rising bottoms lines, while the NYSE Common Only advance/decline line was trying to keep its head above this same trendline of support. In other areas, the NYSE Bond CEF advance/decline line continued to hold steady near its all time highs, with the NYSE REIT advance/decline line seeing a relief rally of sorts as it snapped back toward its declining tops line of resistance. On the negative side, the NYSE Specialty CEF advance/decline line broke below its accelerated rising bottoms line this past week after failing to move into new all time high territory as the secondary market was rather weak as a whole. Overall then, we have a mixed picture right now that would suggest corrective activity, and this should continue as we go into next week's quarterly OPEX.
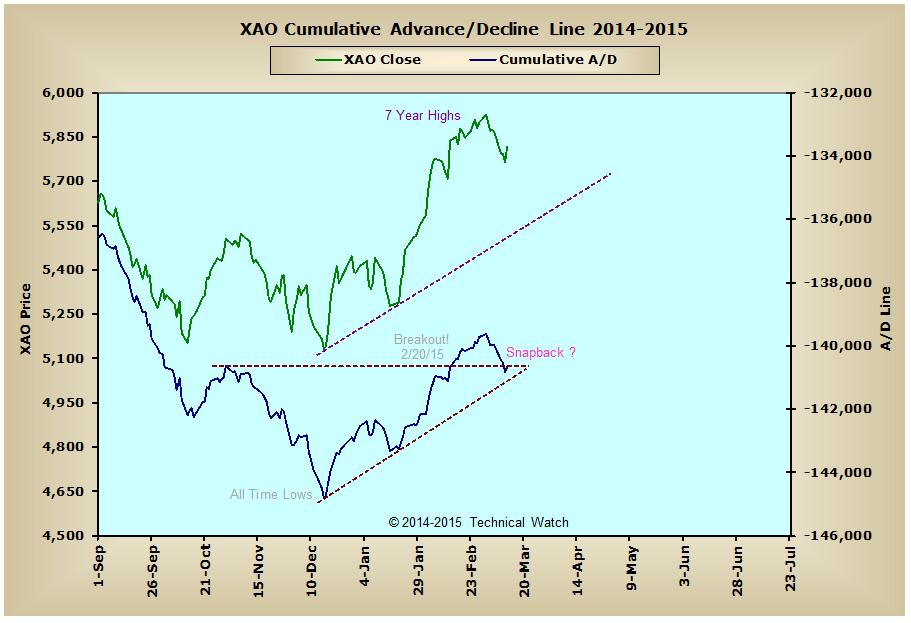
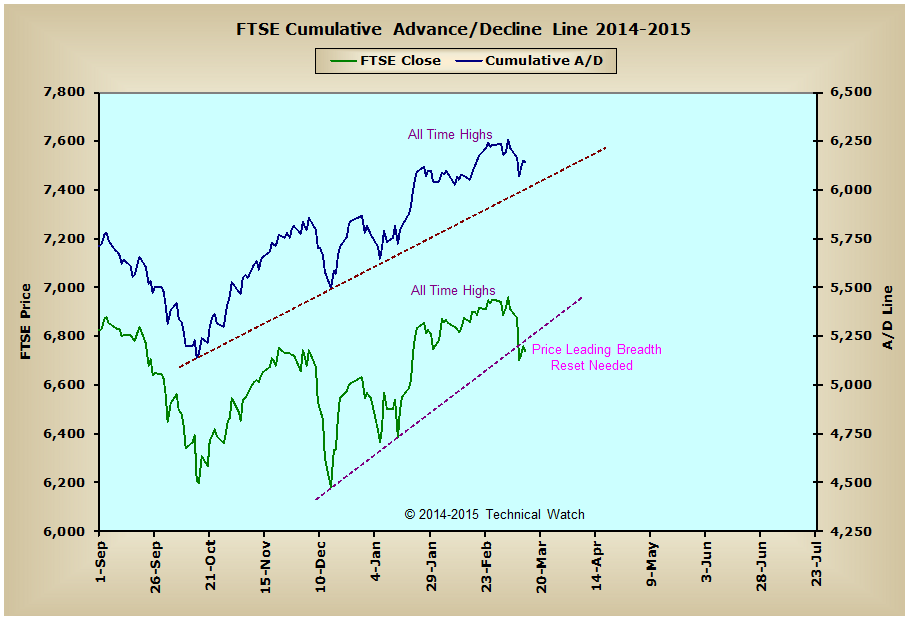
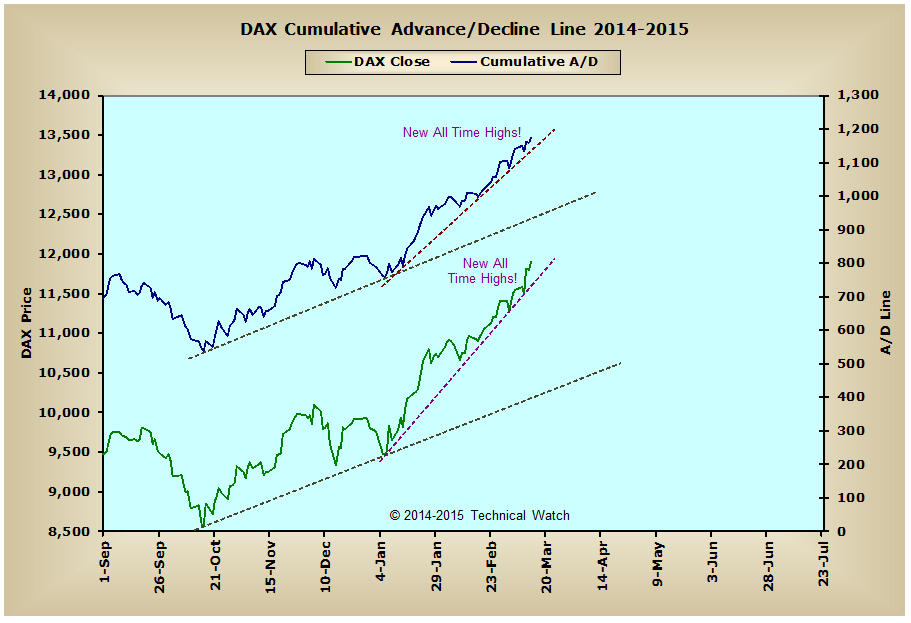
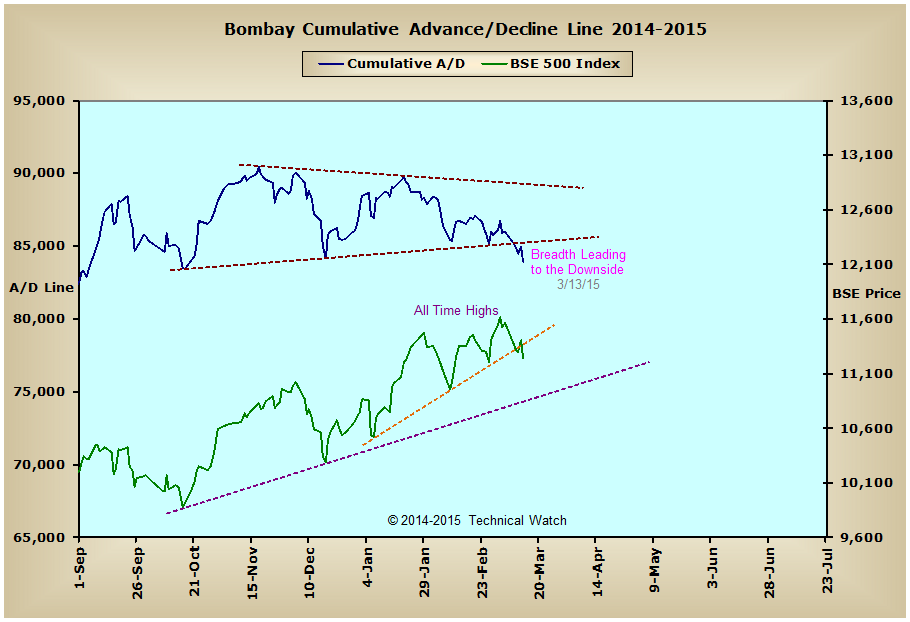
Looking overseas and we see that the DAX advance/decline line continues to show a tremendous amount of investment capital moving into this country's equities as interest rates on the German 2 year bond maintains a negative rate of return and the Euro moved to its lowest levels since 2003. The FTSE and Aussie advance/decline lines moved lower last week in correcting their excess cumulative gains of the last two months, but both remain above their rising bottoms lines from their December lows of last year. Over in India, however, we see that the BSE advance/decline line actually broke to the downside out of its symmetrical triangle configuration which also directly corresponds to a longer term rising bottoms line that goes all the way back to August of 2013. With the BSE A/D line (it's all time highs were in 2005) not being able to match the new all time highs in prices over the last 2 weeks, this could be a significant longer term sell signal for this market in general, so let's keep a watchful global eye for any tremors that might be created by this while moving to a full defensive posture toward India's equity markets.
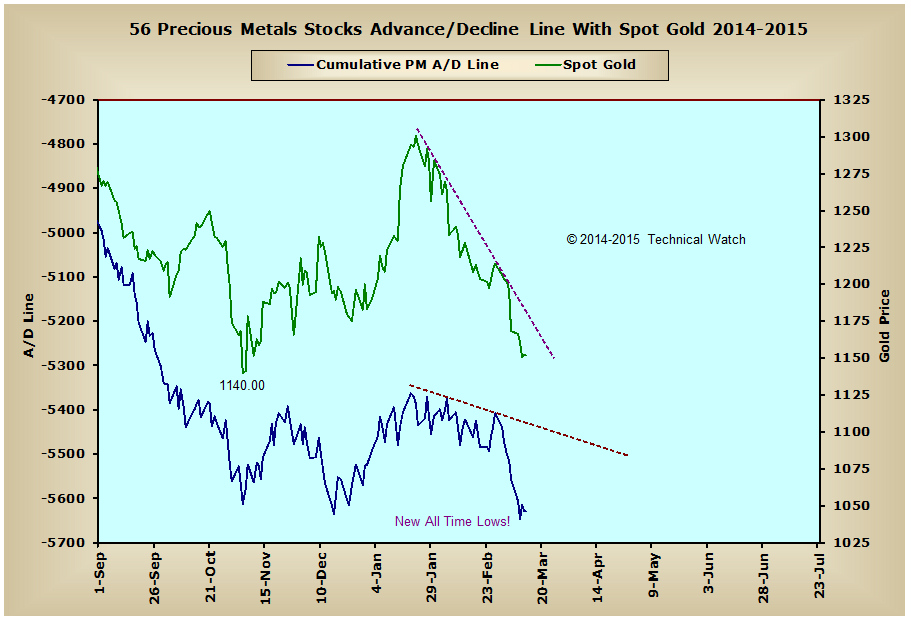
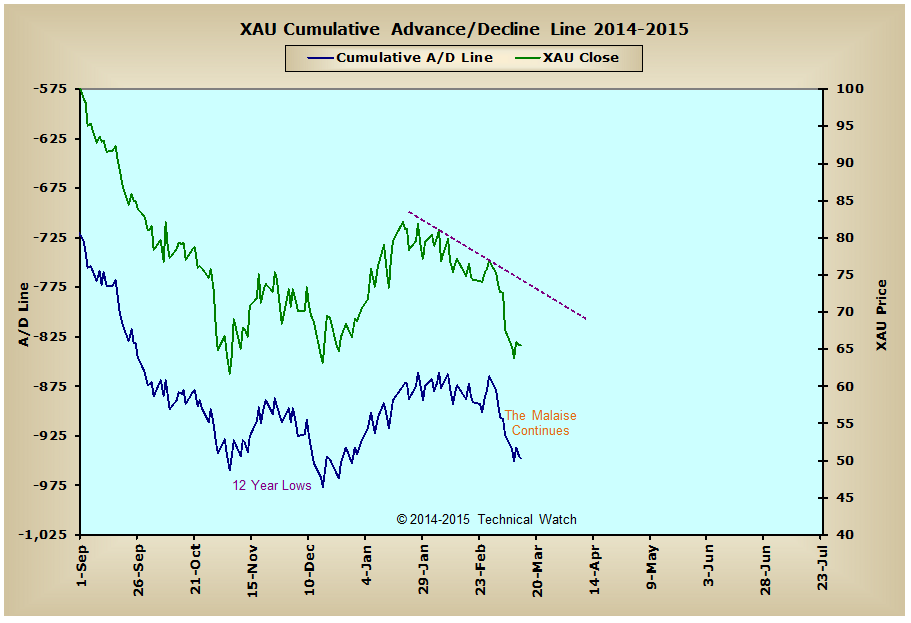
The precious metals asset class remains quite negative with the broader based Precious Metals advance/decline line moving to new all time lows on Tuesday before attempting to find a foot hold from falling apart altogether for the rest of the week. With the price of gold now within $12 of challenging its November 5th closing lows of $1140, it now appears that with these new lows in money flow that the precious metals themselves will have no problems in following money's leadership role in this same direction to what should eventually be a visit with the $1100 level in the yellow metal.
So with large cap breadth moving to deeply oversold levels on Tuesday, and this week's BETS moving into negative territory with a -10 reading, next week is likely to see a continuation of being choppy and volatile as the intermediate term buyers and the short term sellers battle it out for control of the longer term price action. However, as with most indecision patterns of this kind, both sides will eventually be frustrated by each others attempt to lead prices in their preferred direction, and we'll probably wind up with little change when the dust settles next week when March contracts expire on Friday.
Have a great trading week!
US Equity Markets:
US Interest Rates:
US Real Estate:
Precious Metals:
Australia:
England:
Germany:
India:
Technical Watch's Breadth Data Review includes a weekend recap of hard to find breadth measurements from the New York Composite Index, the London exchange (FTSE), the Frankfurt exchange (DAX) and Sydney's All Ordinaries index. Charts are provided with a market narrative by Dave Breslaw and are annotated for additional clarity and suggested positioning. Also included with this service are occasional special posts of longer term data charts to provide a comparable historical context of how internal action of the markets (money flow) can have a direct effect on the direction of price itself. This service works hand in hand with the Chatting the Market subscription service as it provides additional global money flow insights found nowhere else on the internet. More information on subscribing to either or both services can be found by clicking here.


