Posted 29 August 2015 - 05:47 AM
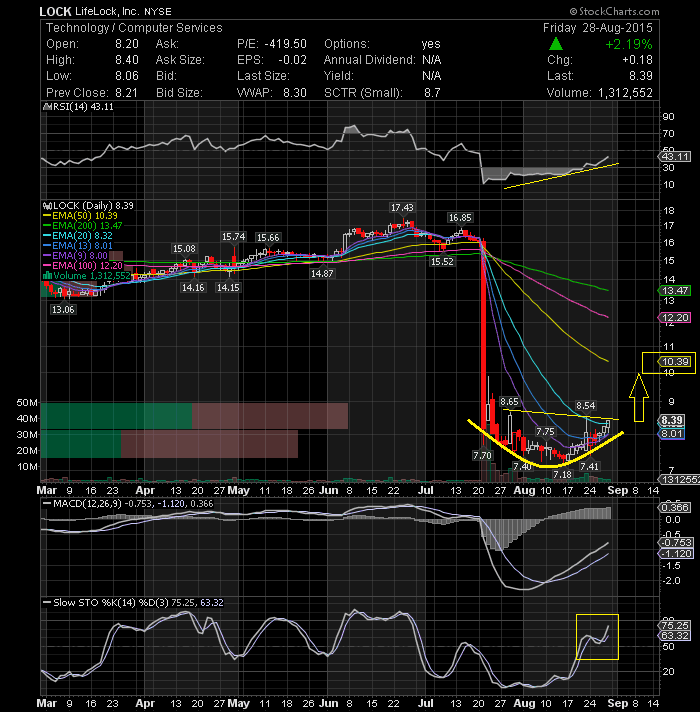
The stock made a very significant move in the last trading session closing above its 20-day EMA which could be signs of a bottom for the stock. Supporting this bullish bias are the technical indicators MACD, RSI and Slow Sto all showing buy signal. The stock seems to be forming a potential rounding bottom pattern and its neckline is around 8.60. A close above this area would have positive implications and could drive the stock up to $10-10.64 in the short-term.. Keep the stock on your radar.
Lots of great setups for next week
Costa
AC Investor Blog Keep up to date by subscribing AC Investor Blog newsletter or RSS feed. You may wish to also follow me on Twitter.