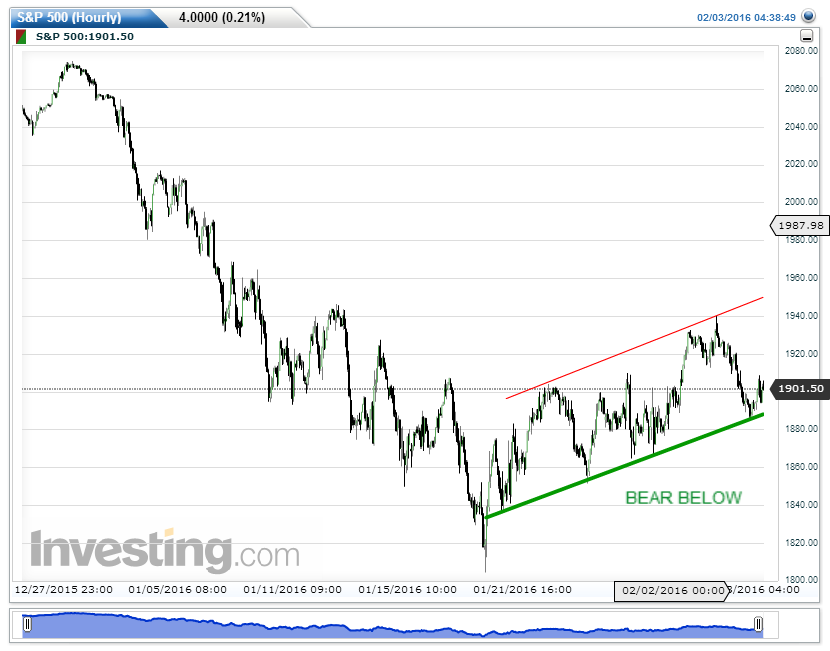
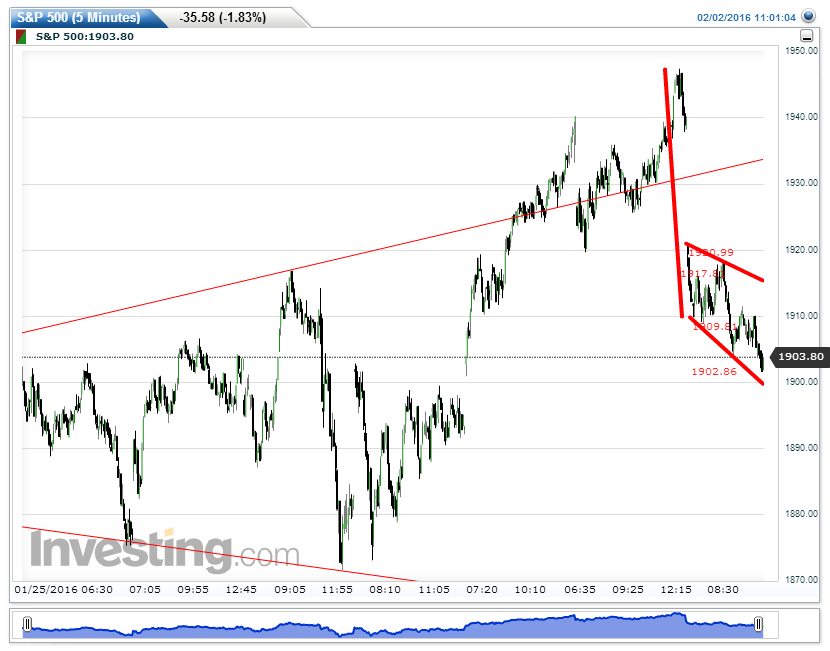
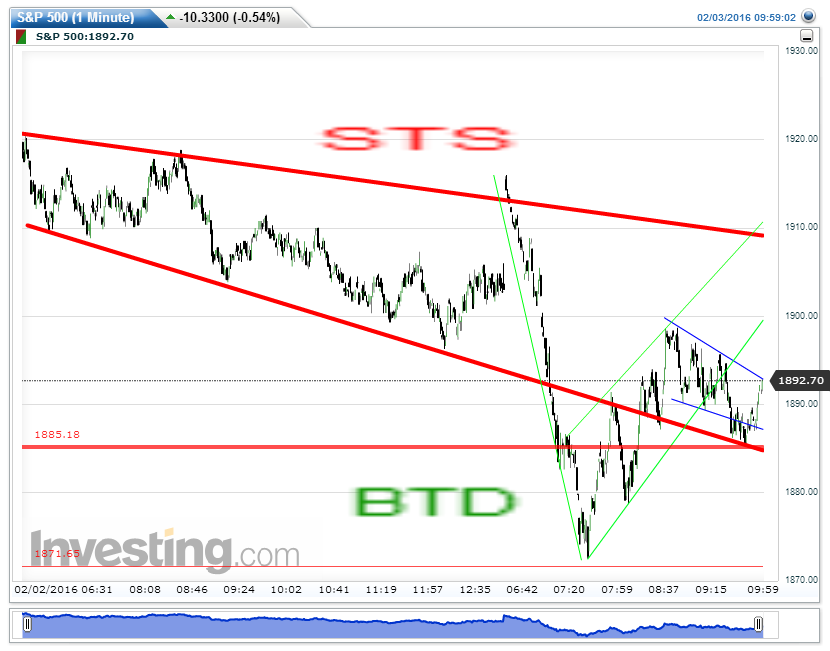
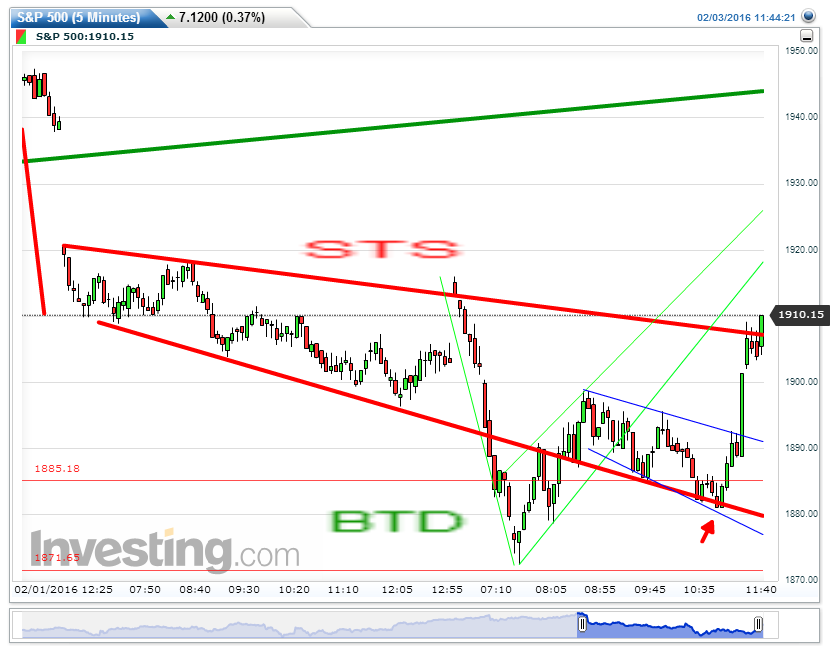
After I posted premarket read, the day opened with a 10+ gap up, which I felt was a "lukewarm" snap of the sickle and prepared for the last defense/offense line battle. Selling relentlessly from the get-go with 43+ pts selloff non stop in first 60 minutes.
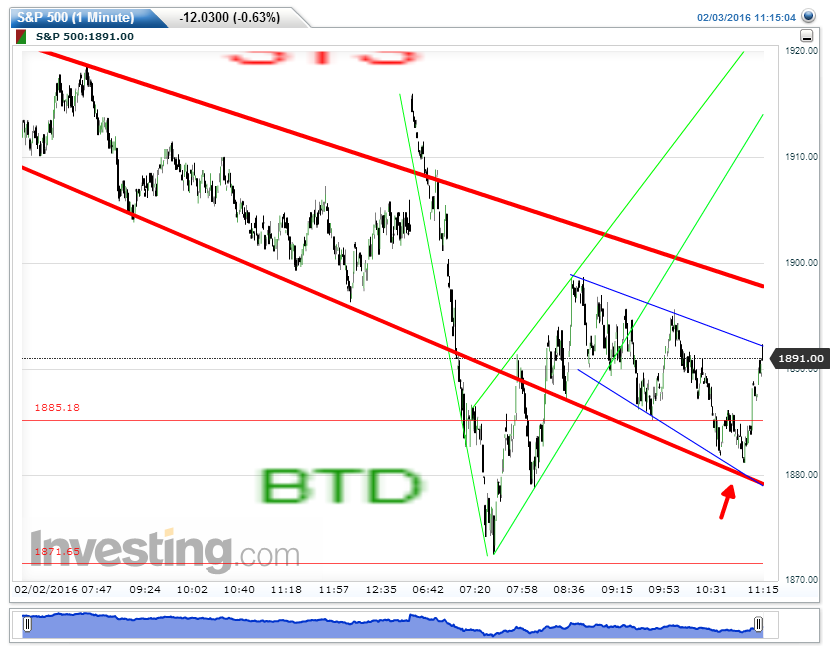
47 min after open, I marked this chart with the original Hockey Stick Red lines of previous day to show the sell off had gone from top red TL to bottom TL and that represent the two line swinging point as "STS" and "BTD"; that the selling is fooling around with the hockey, time to watch out for a sell to buy - the same group selling the gap up spike will be buying the dip around hockey lower red line meeting the larger GREEN channel TLs where price could overshot and throwback.
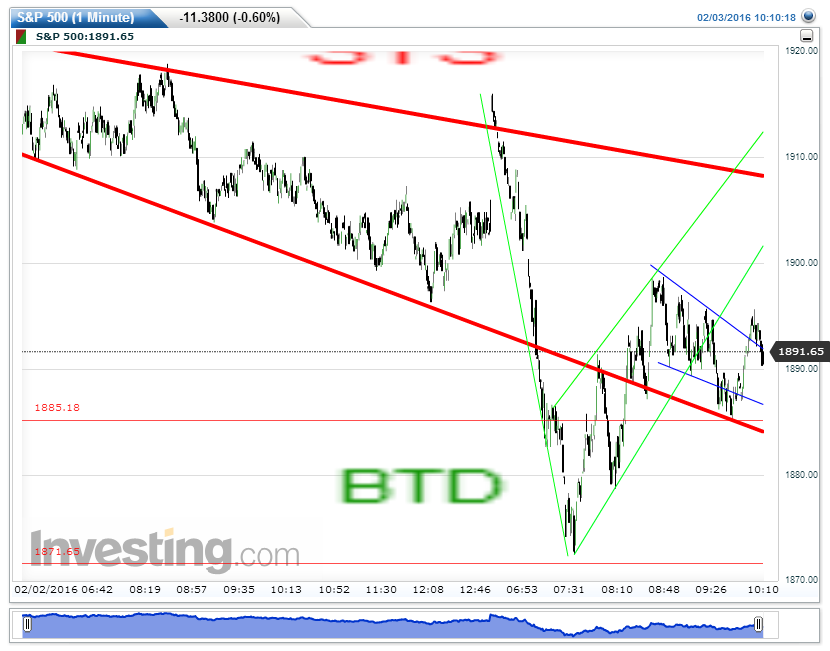
The following 1min charts will show you closeup view of step by step unfolding the process: how the 43pt+ straight down becomes the green flag pole and a green bear flag entailed, than a blue downward bull flag forming as a YinYen Flag (a "W" 'bear left-bull right' flag) that would rally on a counter flagpole.
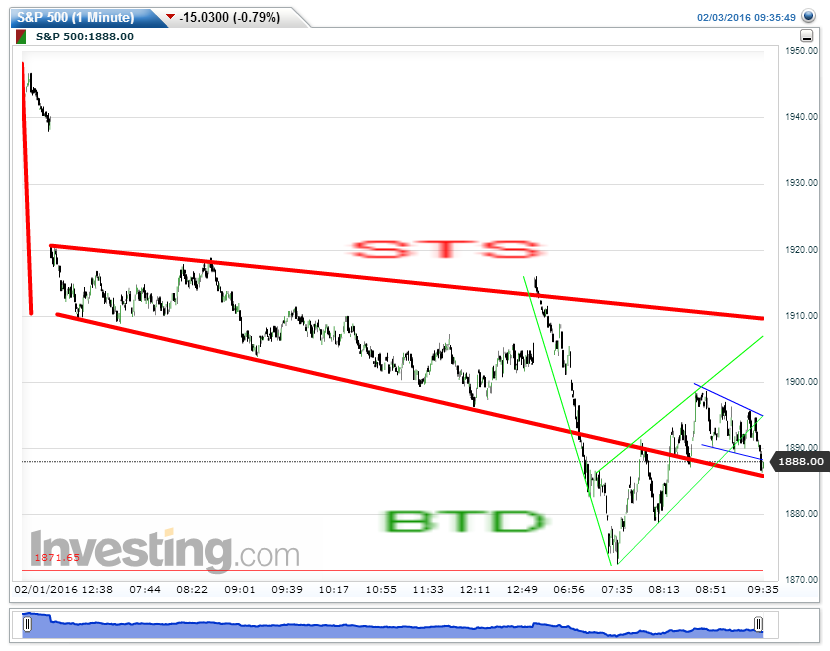
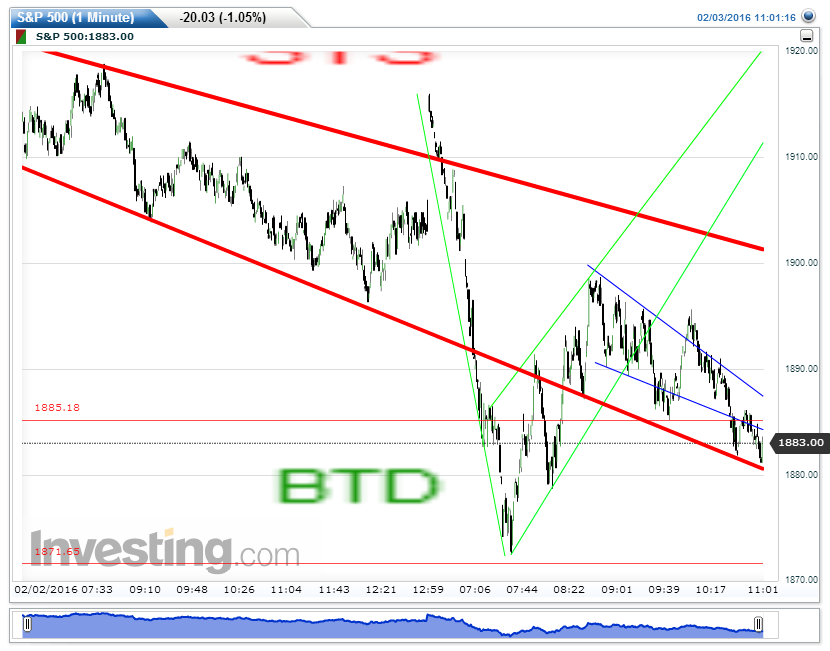
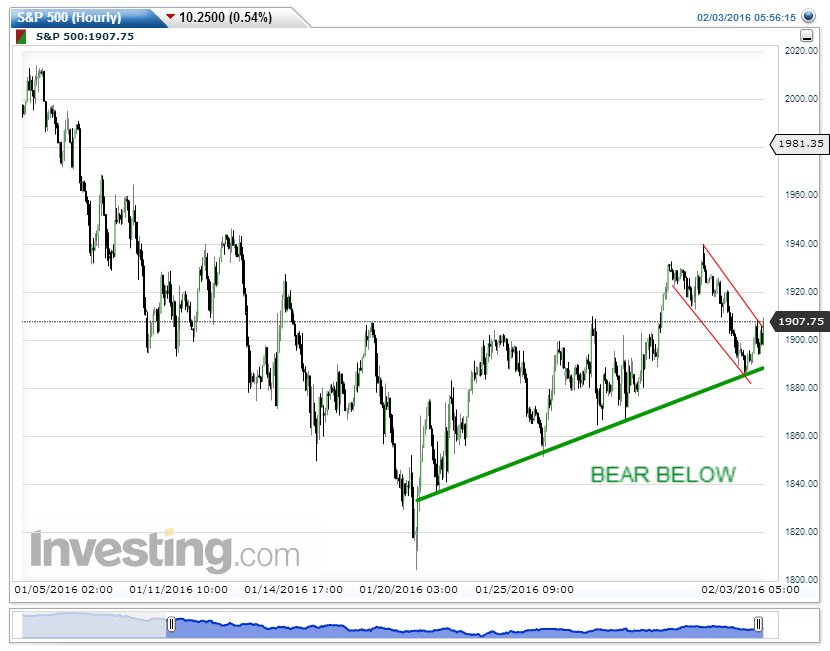
At this point, I can see the movements are well defined and responding to these flags and red hockey line, these lines and patterns ARE FOLLOWED BY EVERY NEXT PRICE TO COME! So I put a red arrow after the second mouse took the cheese of red line bounce, and waiting for the Blue Bull Flag to BO upward this time:
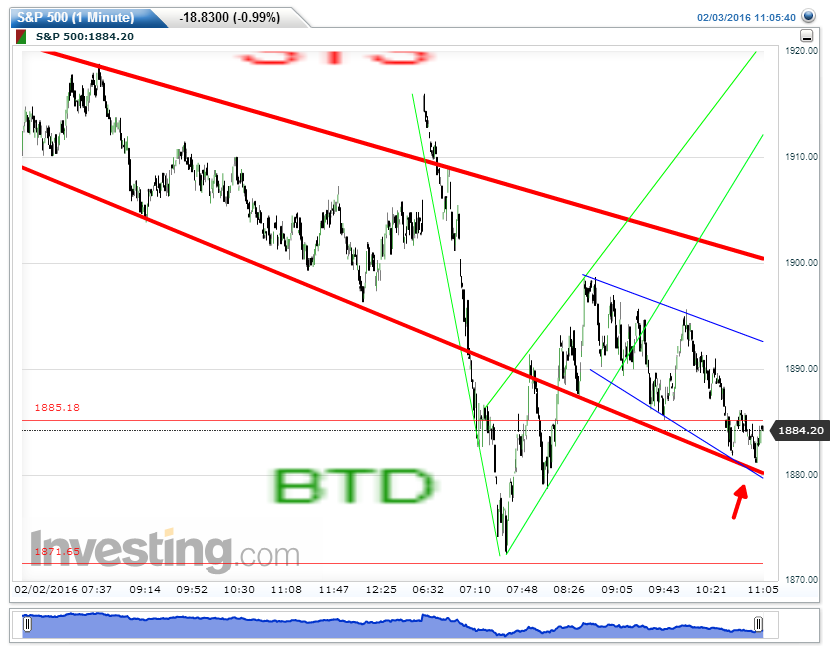
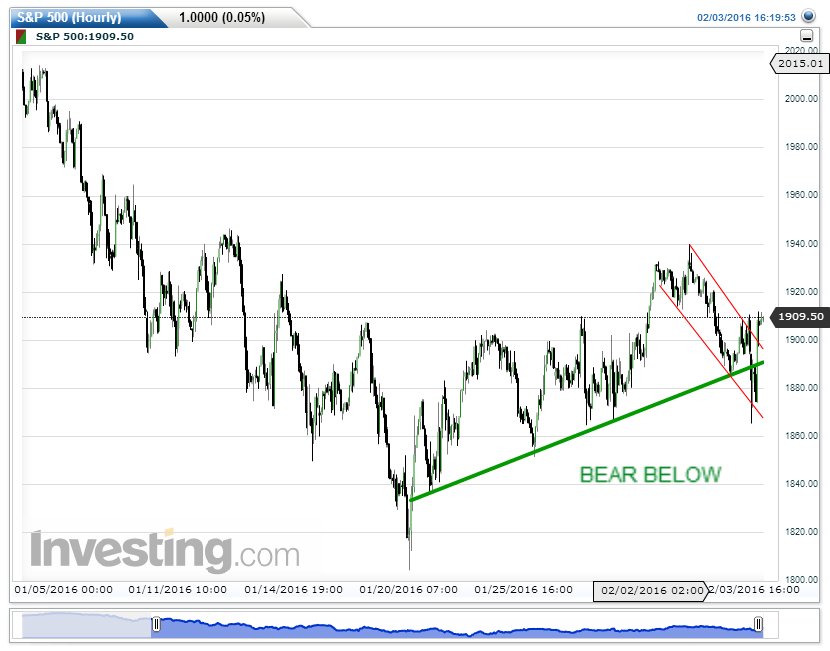
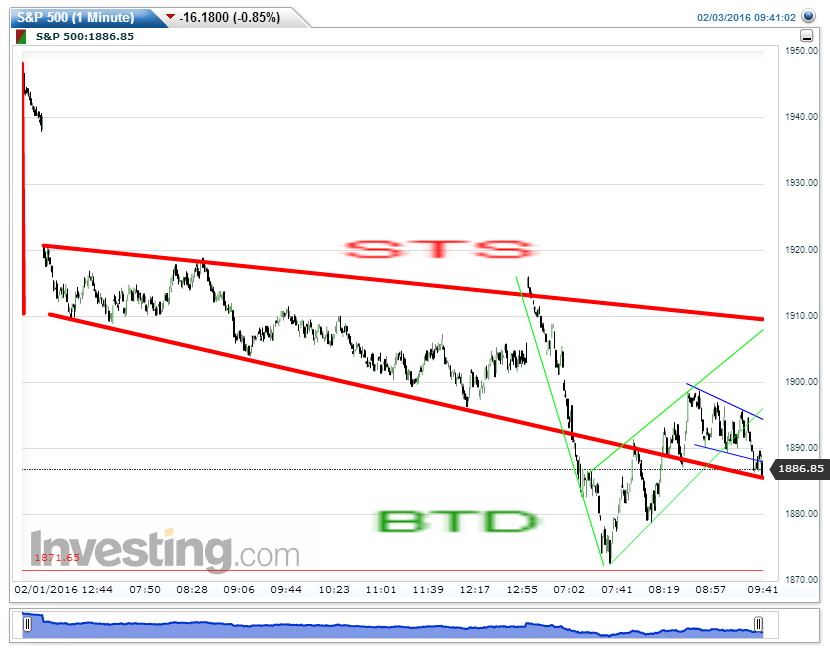
So the push up began, stall at top blue flag TL to confirm this TL is validated, and will be BO next:
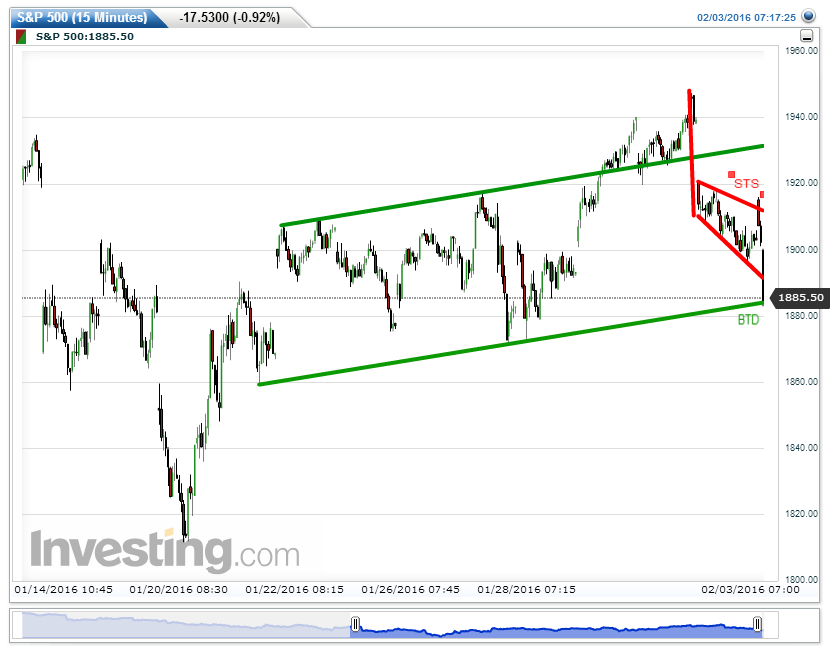
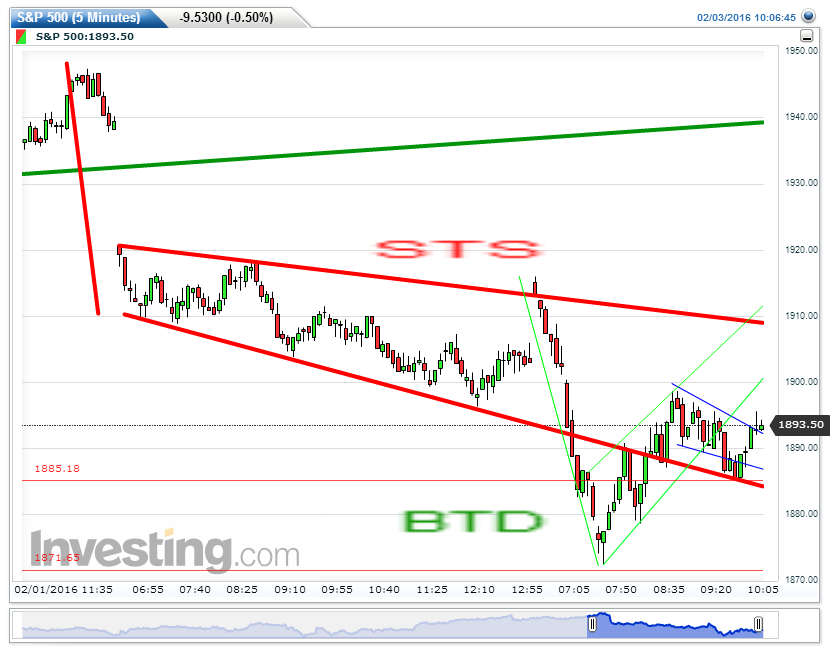
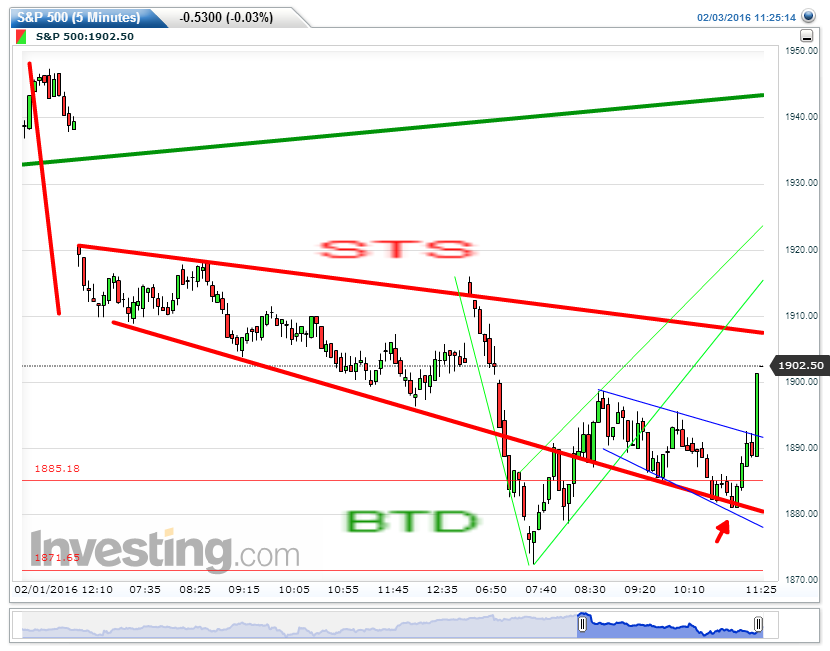
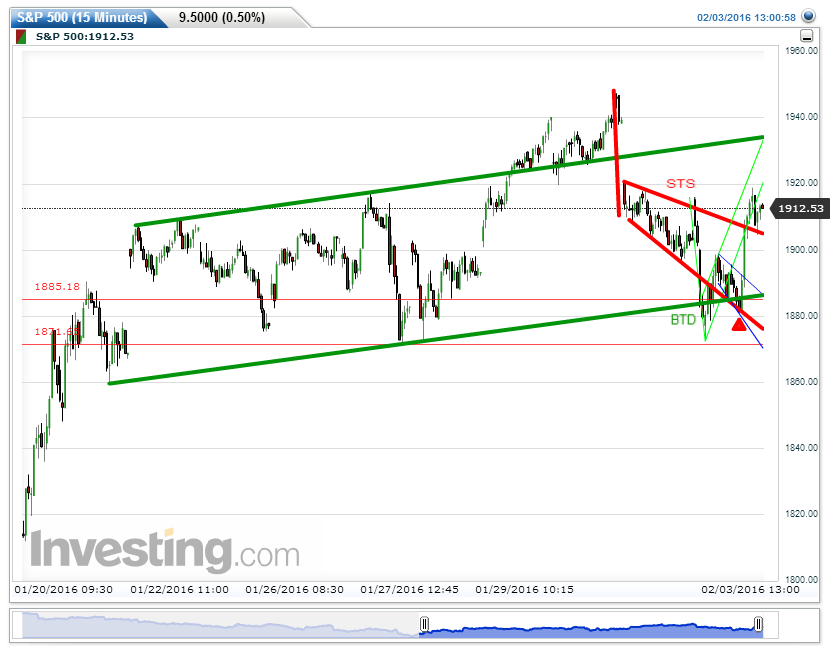
Now 5 min charts are showed to include the left side stick part of this 'growing' Hockey Stick, see the real BO came in force to push up from blue bull flag up to hockey's top Red TL:
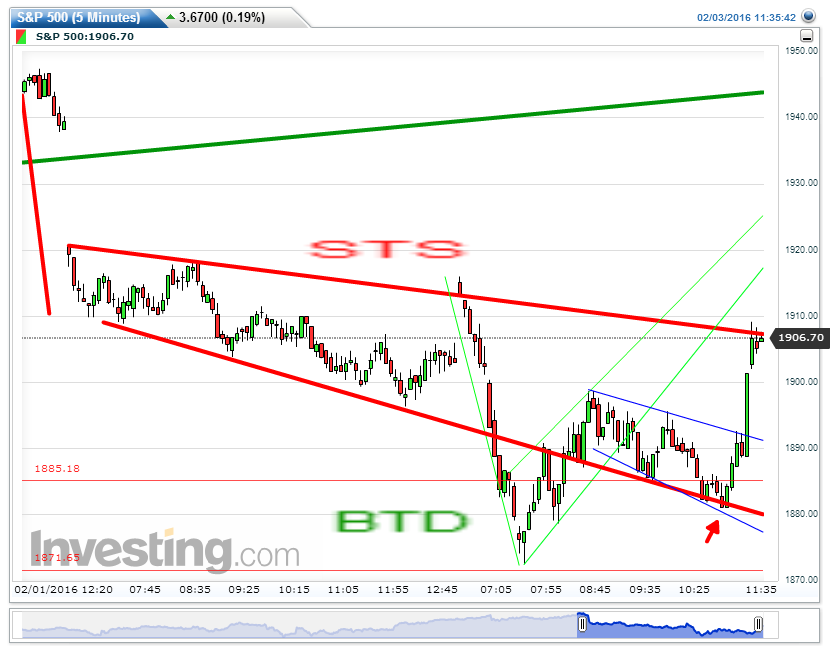
Until the EOD, the hockey stick lives up to its reputation I discovered it to be. And I am grateful Ms. Price once again only teasing but at the end rewarded me. Nah, the real meaning is: if we can detect early a 1-min to 5-min chart pattern and within it the local patterns then WE ARE IN CONTROL OF THE ROADMAP THE GPS of what paths and where targets the price would take and be. Started with 1min building blocks, to 5, 15,...to daily, weekly, monthly... all charts suddenly open up its once seem concealed pathway to you. NOW THAT"S THE WHOLE PURPOSE OF TA, isn't it? Every step of the way, not just a vague and indirect, passive, reactive, second guessing TA. That's what I like to share with you how it's possible and how it's done! This is classic.
Edited by iloli way, 03 February 2016 - 11:53 PM.