

Because of this, there's now a better than even chance that the rest of the market will follow this weakness in the small caps early next week in spite of our already being deeply "oversold" in many areas...
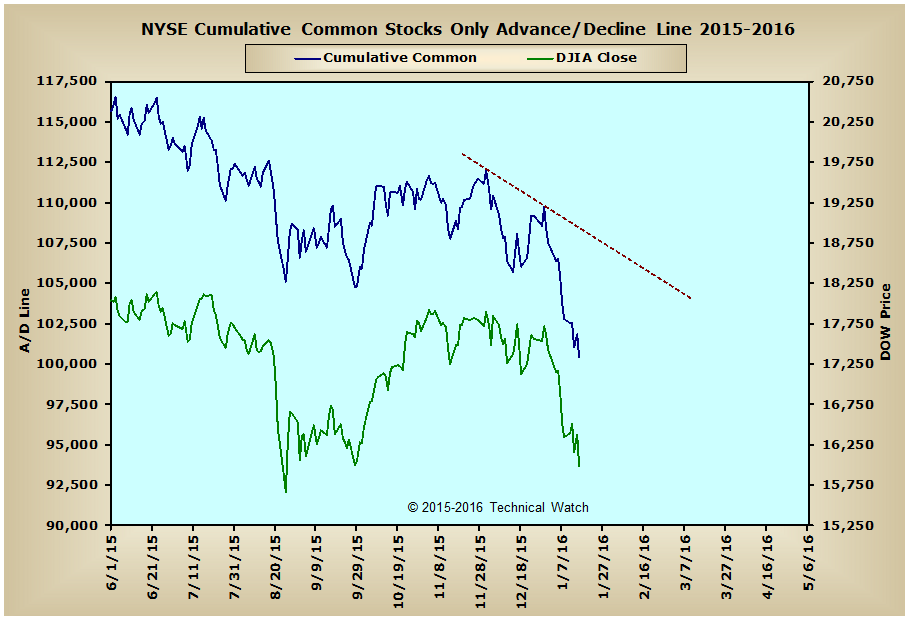
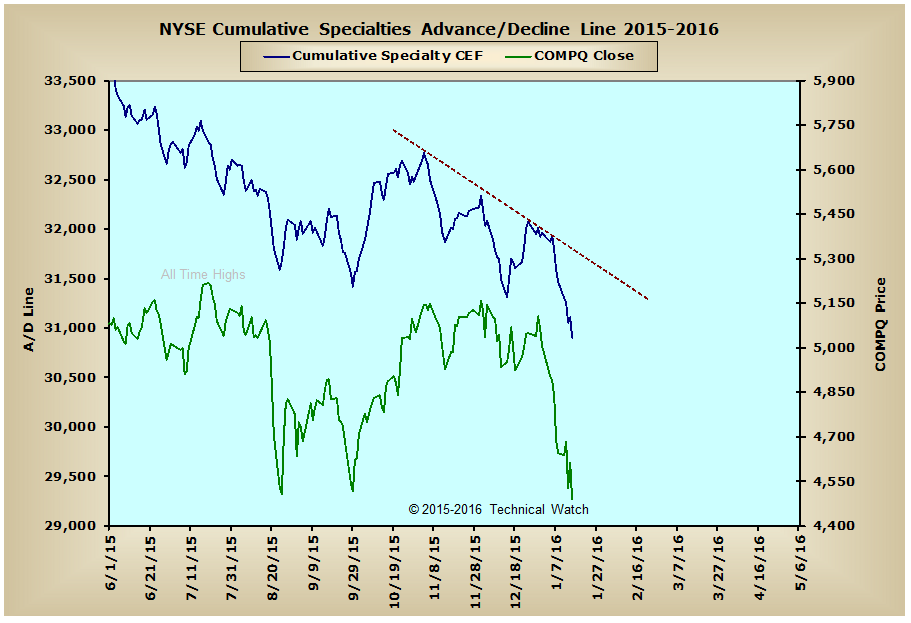
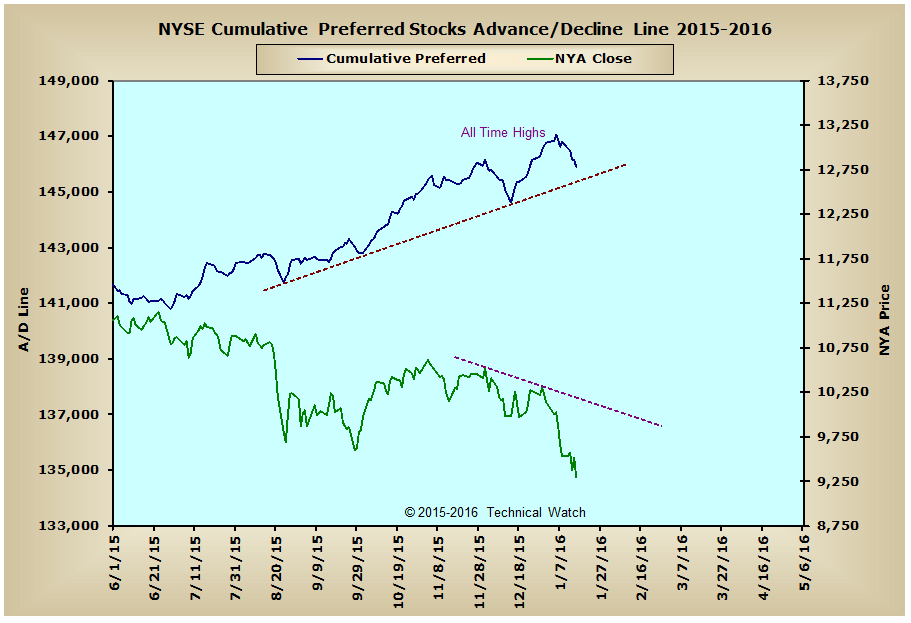
After a somewhat valiant attempt by the market bulls early in the week, stocks finally succumbed to the downside leadership of the small caps and wound up with an average weekly loss of 2.57% at Friday's close, with both the MID and SML basket of stocks now joining the broader based New York Composite Index in closing below their 200 week (4 year) exponential moving averages. Additionally, since the June 2015 peaks, all three of these same averages are now down around 18% from their all time highs, while the Dow Industrials (-13%), S&P 500 (-12%) and the NASDAQ Composite Index (-14%) are not that far behind this debilitating pace.
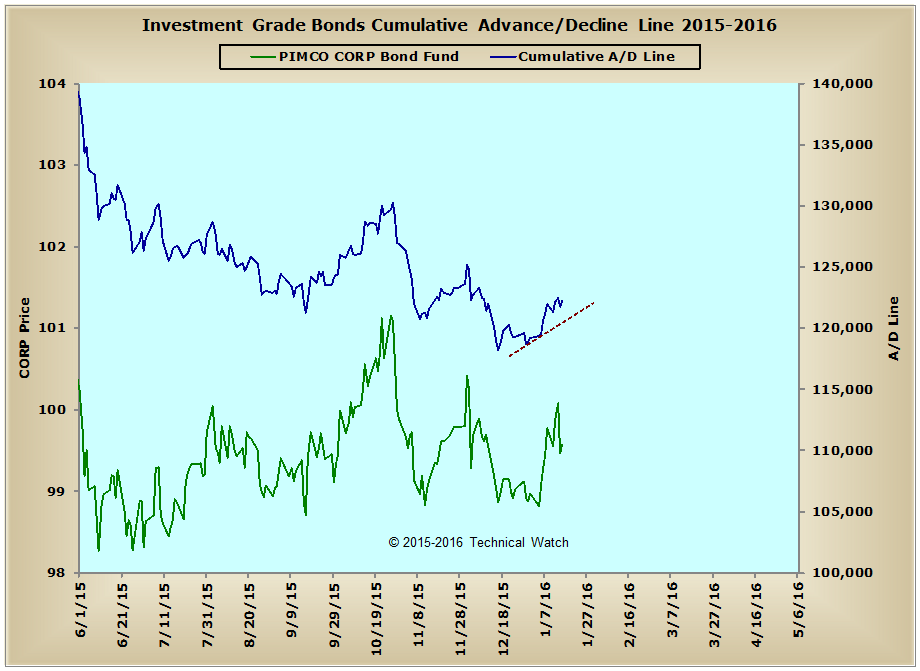
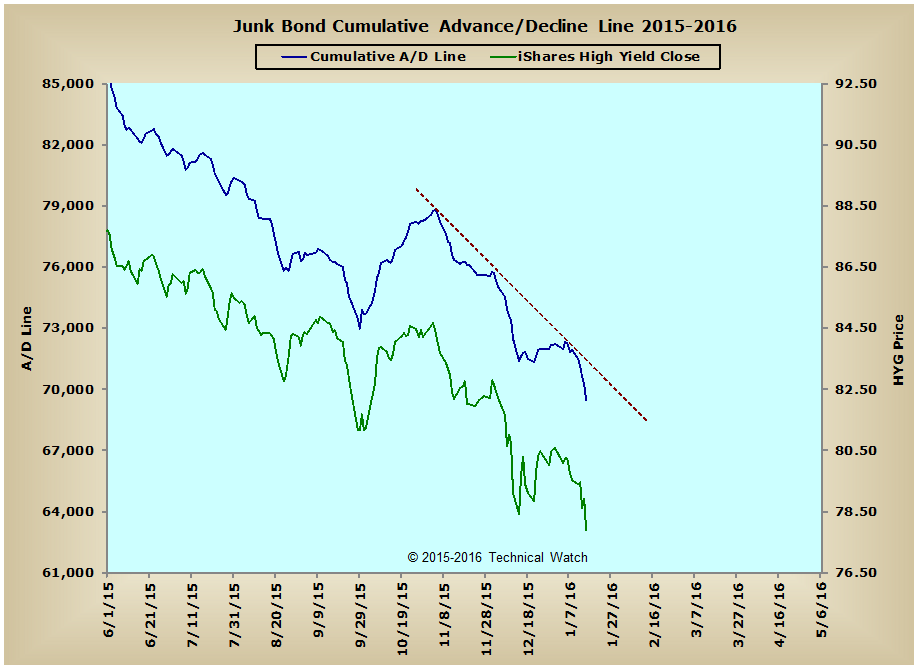
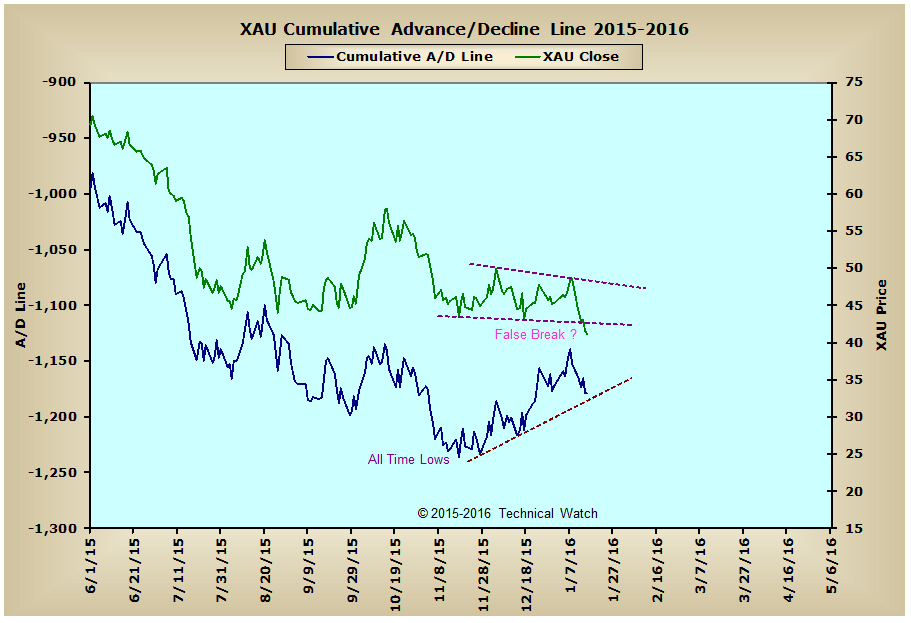
Looking at our breadth charts array for this week shows all to clear the technical damage that permeates the global markets currently with only the Investment Grade Bond advance/decline line showing continued money flow support. Even the Precious Metals advance/decline line wasn't able to hold up in this mass liquidation of equities and has now turned our buy signal from late December to that of taking more of a defensive posture toward this asset class as well. With the Junk Bond advance/decline line continuing to show severe weakness in its pattern structure, this tells us pointedly that market liquidity continues to contract sharply making it difficult for stock prices to show any kind of buying follow through after any obligatory relief rallies that come from time to time in the current declining trend. Overall then, we have all the ingredients in place of bear market conditions as this time, and that any and all remaining upside price targets have now been cancelled.
So with the BETS back to matching the lows seen in mid December at -75, we are currently "oversold" enough to where a pause in the downside trend can take place at any time, but it's not likely that we'll have the opportunity of seeing a tradable bottom in equities now until sometime in February. With the CRB index of commodities now at levels not seen since May of 1973, it's become quite clear that a deflationary mark down in valuations continues to weigh heavy on equities at this time, and where high quality treasuries bills, notes and bonds will likely be the beneficiary areas of investment. With all that said, however, let's also remember that being in cash is also a position, and with market volatility as high as it is right now, sitting on your hands and waiting for things to run its course may not be a bad idea either.
Have a great trading week!
US Equity Markets: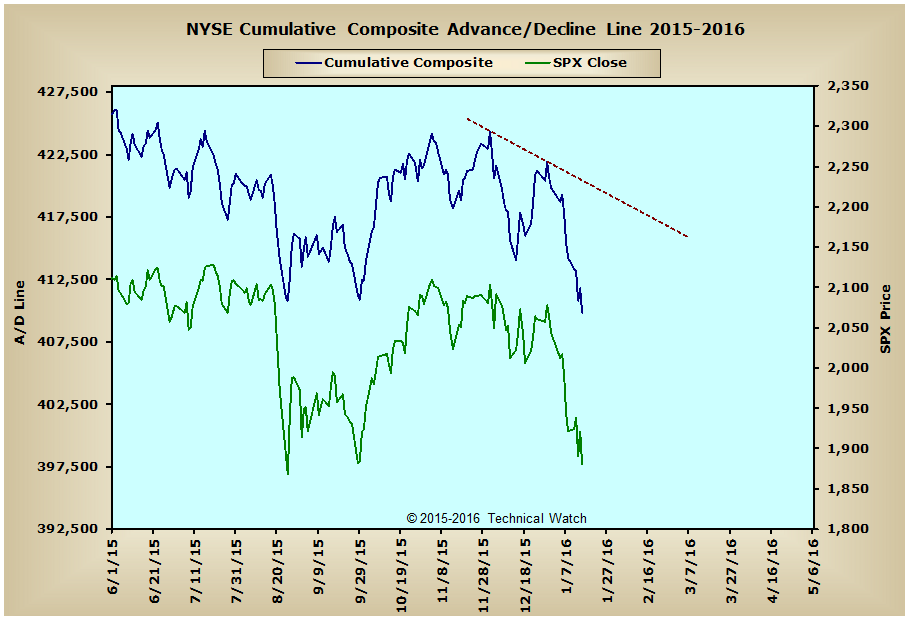
US Interest Rates: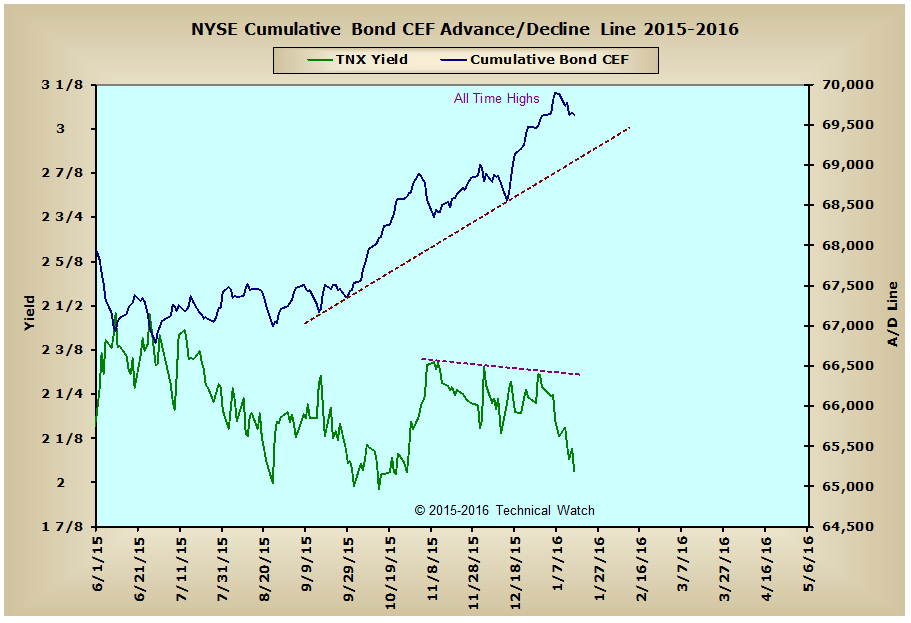
US Real Estate: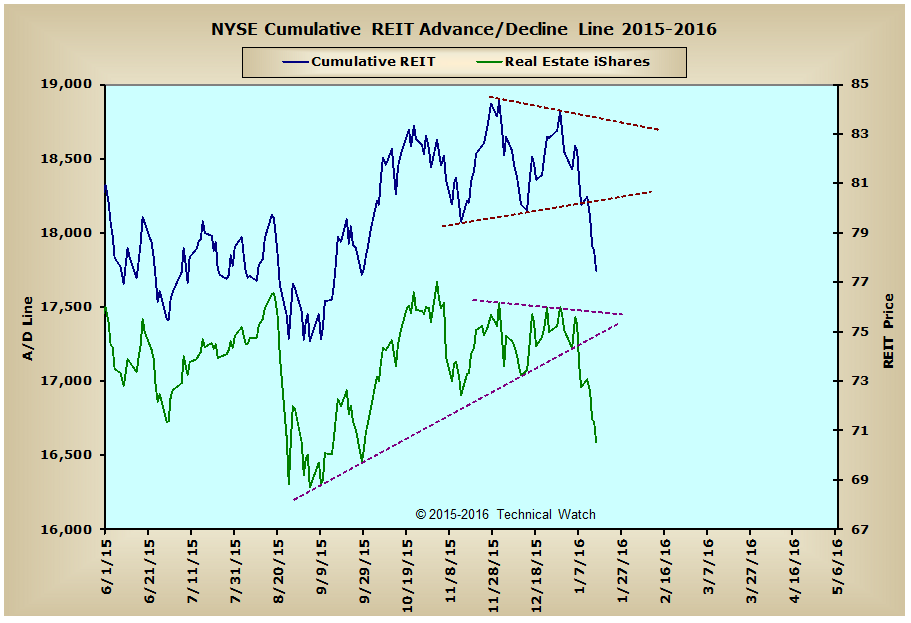
Precious Metals: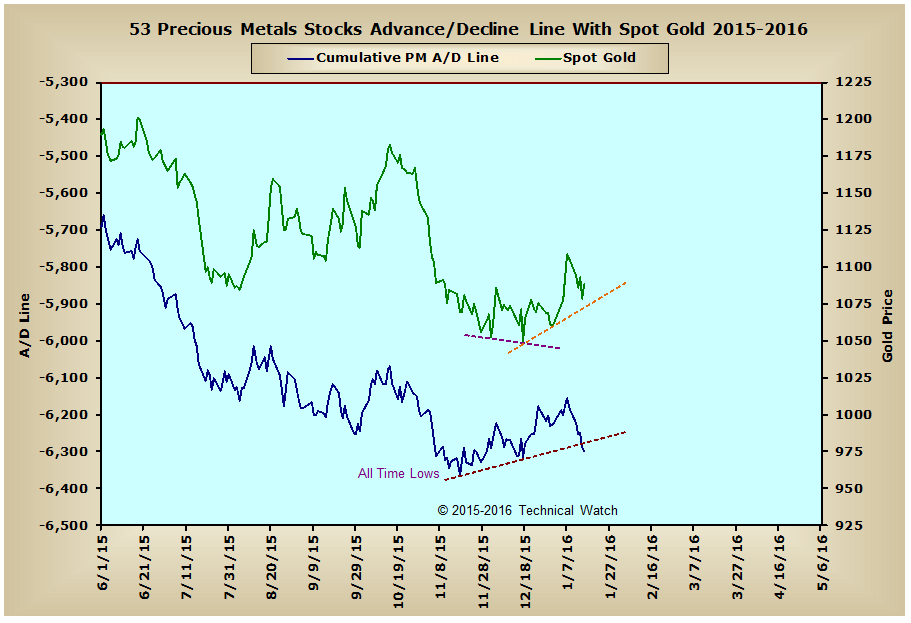
Australia: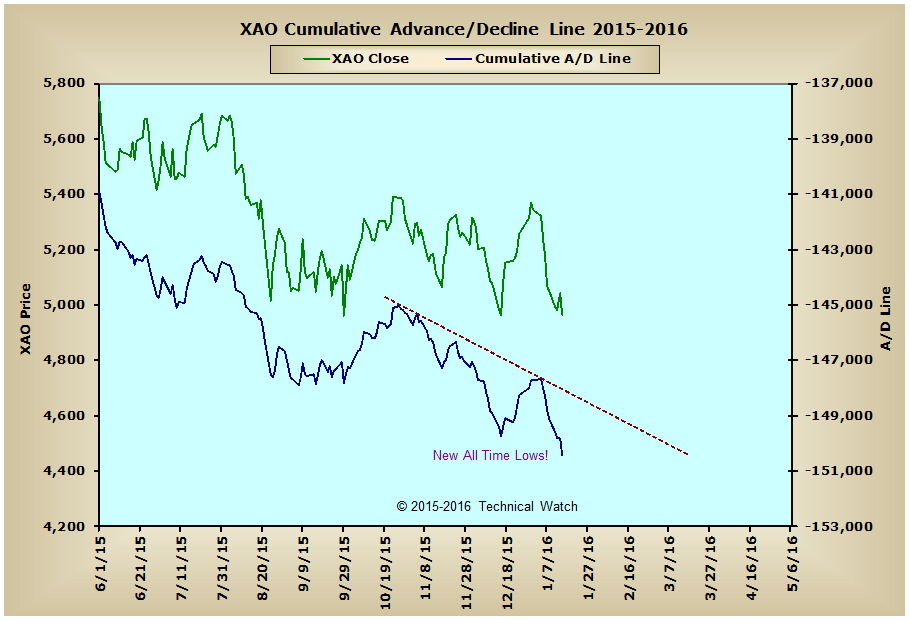
England: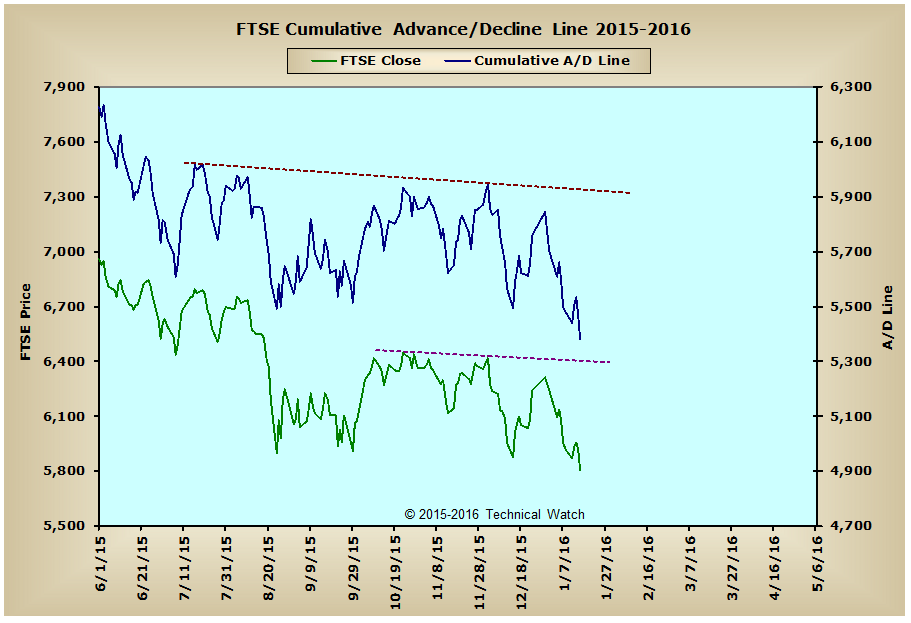
France: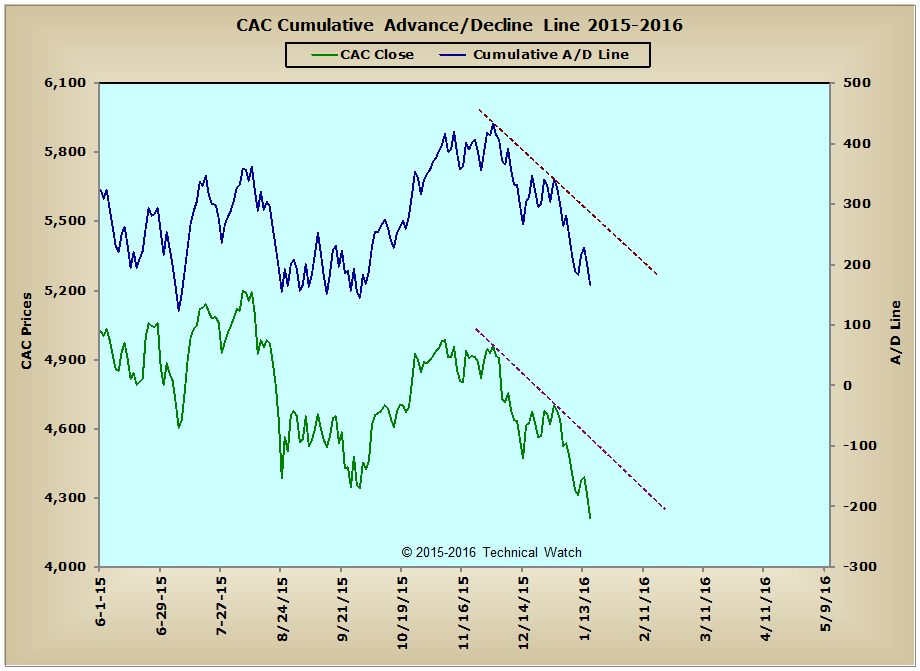
Germany: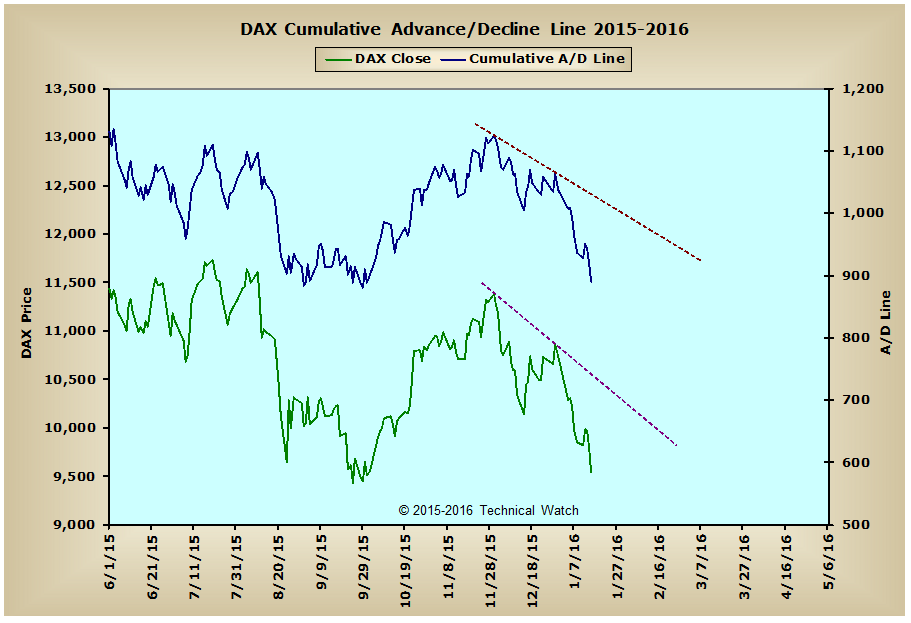
India: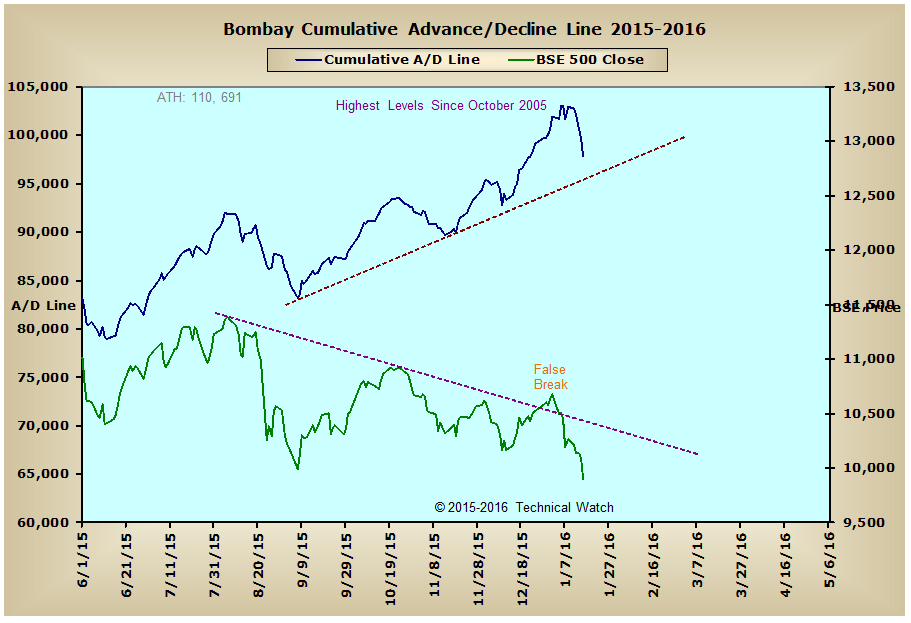
Technical Watch's Weekly Breadth Data Review includes a weekend recap of hard to find breadth measurements from the New York Composite Index, the London exchange (FTSE), France's CAC Index, the Frankfurt exchange (DAX), the Sydney exchange (AORD), and India's Bombay exchange (BSE). Charts are provided with a market narrative by Dave Breslaw and are annotated for additional clarity and suggested positioning. Also included with this service are occasional special posts of longer term data charts to provide a comparable historical context of how internal action of the markets (money flow) can have a direct effect on the direction of price itself. This service works hand in hand with the Chatting the Market subscription service as it provides additional global money flow insights found nowhere else on the internet. More information on subscribing to either or both services can be found by clicking here.


