Jump to content


Photo

SPX thoughts


  • Please log in to reply
363 replies to this topic

#1 tsharp

tsharp

    Member

  • Traders-Talk User
  • 1,487 posts

Posted 28 February 2016 - 01:13 AM

It's been some time since I've last posted here.  In the past, I was persuaded that the high the SPX saw in 2000 was a Wave-III high, rather than a Wave-V high, and called for several years for a Wave-IV to play out. It finally did so in early 2009, and from my perspective, we pushed upward to wave-A of diagonal triangle at the 2130s and fell back in wave-B at the recent lows of 1810.  


If my count is correct, we are about to move upward again in wave-C, and this should take us to new highs.  The chart I share here was prepared before the trading day last Friday and while it remains to be seen what exactly will play out, as there are several price possibilities above, this is just one possibility, based on the pattern of the diagonal triangle that ended the move up from 1998 to 2000.


Finally, the time I pushed out the possible pattern is not what I suggest will play out, but merely a pattern that could play out going forward, as I do not see the topping process lasting beyond 18-months from now.


Just my two cents worth...


http://postimg.org/image/ah2u7xerl


#2 alexnewbee

alexnewbee

    Member

  • Traders-Talk User
  • 1,459 posts

Posted 29 February 2016 - 01:22 PM

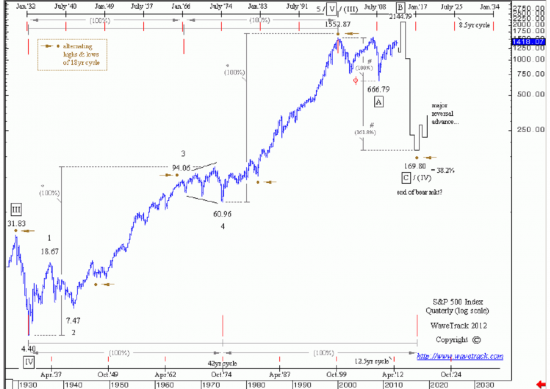
Think this count is more probable at the moment.

54ccf0.png


"we do G.d's work" Lloyd Blankfein

#3 tsharp

tsharp

    Member

  • Traders-Talk User
  • 1,487 posts

Posted 29 February 2016 - 02:38 PM

This was an alternate short-term picture I considered last week, if accurate, we've seen the top of the expanding triangle and need to go down one more time, but IMHO the downward movement would likely be a truncated 5th.


Cheers!


http://s20.postimg.o...PX_Daily_EW.jpg


#4 tsharp

tsharp

    Member

  • Traders-Talk User
  • 1,487 posts

Posted 29 February 2016 - 08:33 PM

Okay then newbee, a few questions:

  • I see this is not your chart; is there any way you could get it updated?
  • The SPX did not hit 2140ish; is it good enough to count as complete?
  • If I interpret the chart correctly, it suggests we are now in a severe correction that appears to last for all of 2016; yes?
  • What would it take to invalidate that chart?

Thanks!


#5 alexnewbee

alexnewbee

    Member

  • Traders-Talk User
  • 1,459 posts

Posted 01 March 2016 - 01:54 AM

yes, it is not my chart, it is from wavetrack, you can see it on the pic. it is from 2012, that is exactly the reason why it is interesting.

but very close to 2140, it does not have to be exact point, does it?

yes.

exceeding 2200 or even going sideways for next couple of years.


"we do G.d's work" Lloyd Blankfein

#6 tsharp

tsharp

    Member

  • Traders-Talk User
  • 1,487 posts

Posted 01 March 2016 - 08:48 AM

I mentioned above that there are potential targets above what my first chart suggested, so here I'm posting an alternate count that includes one of those higher targets.  If we are in a SuperCycle or Grand SuperCycle topping process, then I suggest we could see a possible blow-off top to match... time will tell.


http://postimg.org/image/mwxj9qnyx/


#7 Alton

Alton

    Member

  • TT Member+
  • 210 posts

Posted 02 March 2016 - 10:51 PM

I confess to being stymied by Elliott Wave because of the variety of interpretations which seemingly can be applied to a single chart.  And of course the varying counts sometimes lead directly to contention.

Glad to see you back tsharp.  You are well remembered from the early part of the century.  I recall your work as being very fine, and look forward to learning from you.


#8 tsharp

tsharp

    Member

  • Traders-Talk User
  • 1,487 posts

Posted 03 March 2016 - 08:09 AM

Thank you for the kind words... I appreciate the welcome back.  


Yes, it's absolutely true that interpretation is varied.  To be sure, it took me nearly two years to assign the rise from the 1998 lows into the 2000 peak (at the time) as a diagonal triangle. Prechter and company and most every other fractal technician had it labeled as standard five waves up (AND the end of the bull market), but the symmetry just didn't work for me, then I had a eureka moment, and broke ranks with my own version of that count that made sense, including a prolonged Wave-IV with new all-time-highs to follow, and I still think is correct... and I digress.


Thanks again... we're at a critical juncture over the next couple of months.  If the SPX can push upward to new highs, AND with Europe and Asia in shambles (economically), I suspect major capital flows into the US could hyper-inflate our financial markets to unrealistic proportions... time will tell.


#9 alexnewbee

alexnewbee

    Member

  • Traders-Talk User
  • 1,459 posts

Posted 03 March 2016 - 09:05 AM

as an alternative view - what if we are talking about destruction of capital instead of moving? it is all credit money...


"we do G.d's work" Lloyd Blankfein

#10 tsharp

tsharp

    Member

  • Traders-Talk User
  • 1,487 posts

Posted 03 March 2016 - 11:57 AM

There's bound to be some destruction of capital in the moving of capital, until it lands where the market is moving upward again.  I think you would do well to read Martin Armstrong, his insights have helped me and I'm sure anyone else who reads him, except the perma-anythings... i.e. perma-bulls, perma-bears, goldbugs, etc.