Jump to content


Photo

SPX thoughts


  • Please log in to reply
363 replies to this topic

#361 tsharp

tsharp

    Member

  • Traders-Talk User
  • 1,487 posts

Posted 25 May 2019 - 06:27 PM

Last week I said this about Crude Oil:


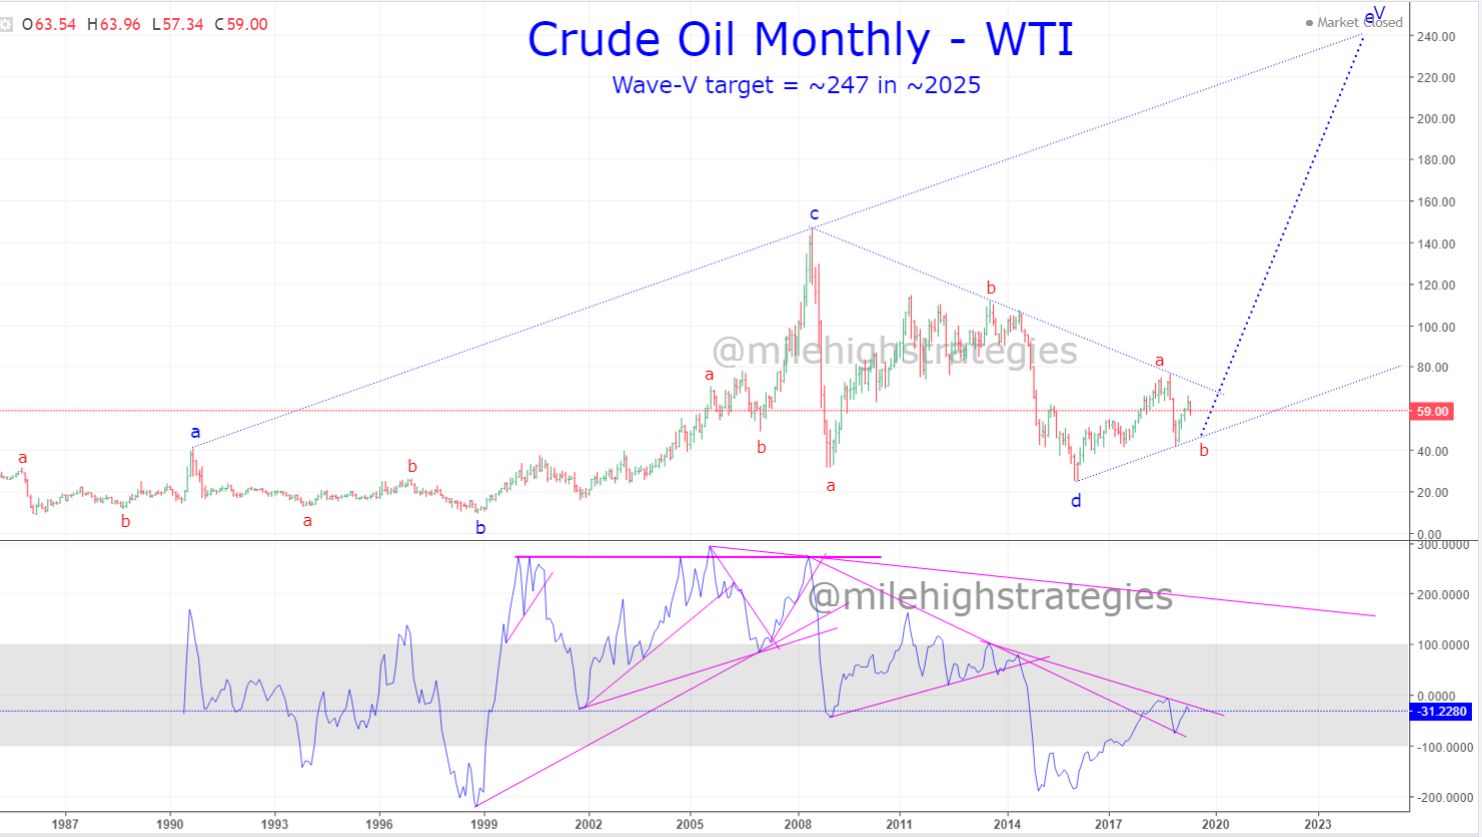
CRUDE OIL - any trading strategy with crude oil will require much patience and a decent view of its long-term trend...

In 1990, the Wave-A:V high of a developing ending diagonal triangle Wave-V completed at about ~41...

In 1999, the Wave-B:V low of the developing EDT completed at about ~10...

In 2008, the Wave-C:V high, and present ATH of that same EDT completed at about ~147...

In 2016, the Wave-D:V low of the developing EDT completed at about ~26...

And now, Wave-E:V is in work with a likely completion target date in the mid-2020s, and with price targets of ~203 - ~247...

Due to the previous symmetry within each of the waves, it seems one more drop in a wave-b:E to the ~40ish range would be in order, before the move to new ATHs gets going... watching. 


This week I follow-up with this:


CRUDE OIL - last week I mentioned the potential for a pull back in price to complete wave-b:E:V to as low as ~40, then a push upward to ~247 into mid-2020...

This is the chart of WTI Crude monthly with how I see this scenario could play out... watching. 


CL-M-5-25-19-1.jpg


#362 tsharp

tsharp

    Member

  • Traders-Talk User
  • 1,487 posts

Posted 26 May 2019 - 08:47 AM

ASIA - with President Trump currently visiting Japan, I thought it would be appropriate to take a looksy at Asia, using the Nikkei 225 weekly as a proxy for Asia, much as I use the SPX as a proxy for the US and the DAX as a proxy for Europe...

Japan's ATH, and Wave-III peak was in January 1990...

A bear market ensued for some 19-years, lasting until March 2009 (this is also why I'm so bearish on BTC)...

Since then, the Nikkei 225 has risen in a series of 3-3-3-3-3 pattern, in what appears to be a truncated ending diagonal triangle, though an alternate fractal interpretation could suggest that only wave-c:V completed, and wave-d:V is in work, and in light of my take on the US markets, I'm starting to lean that way...

For now, there was a rejection of the momentum indicator line by a latent UTL and the top of the gray zone resistance level, so the ST trend remains down... watching. 


JP225-W-5-24-19.jpg


#363 tsharp

tsharp

    Member

  • Traders-Talk User
  • 1,487 posts

Posted 03 July 2019 - 04:53 PM

With the SPX approaching an intermediate target I've had on my radar for a long time, I thought to show how this has played out since 1.4.19, when I first forecast the SPX to recover to new ATHs within months, rather than the years (if at all) that many were looking for in our community...


Epic forecast made on 1.4.19:


SPX-D-1-4-19-1.jpg


An alternate fractal from 2.15.19:


SPX-D-2-15-19.jpg


An alternate fractal from 3.29.19:


SPX-D-3-29-19-Alt.jpg


Again from 5.10.19:


SPX-D-5-10-19-projection.jpg


SPX as of today:


SPX-D-7-3-19.jpg


And how I could imagine the SPX fractal working out into years's  end:


SPX-D-7-3-19-1.jpg


#364 mss

mss

    I'M WATCHING

  • TT Sponsor
  • 6,182 posts

Posted 26 February 2020 - 08:13 PM

IT WANT SEND - SAYS MY CHART IS SPAM.


WOMEN & CATS WILL DO AS THEY PLEASE, AND MEN & DOGS SHOULD GET USED TO THE IDEA.
A DOG ALWAYS OFFERS UNCONDITIONAL LOVE. CATS HAVE TO THINK ABOUT IT!!