This SOXX chart says it all here.... it is right at support at 638, and falling under takes it to S1 at 626 and S2 at 608.
As you can see there is a zone of unstable price underneath and nothing to stop it...
So they need like 640+ here or else...


Volume Dynamics Specialist
Posted 04 May 2016 - 09:07 AM
This SOXX chart says it all here.... it is right at support at 638, and falling under takes it to S1 at 626 and S2 at 608.
As you can see there is a zone of unstable price underneath and nothing to stop it...
So they need like 640+ here or else...
Member

Posted 04 May 2016 - 09:15 AM
Yep, just like NQ, multiple more intermediate time frames hang in the balance RIGHT HERE....
The strength of Government lies in the people's ignorance, and the Government knows this, and will therefore always oppose true enlightenment. - Leo Tolstoy
Volume Dynamics Specialist
Posted 04 May 2016 - 09:35 AM
They have to buy this group now to hold the market together...
Hard to be short the stuff they have to buy.
Member
Posted 04 May 2016 - 09:42 AM
On a longer outlook, SOX actually looks quite similar to the Dow in the mid 1940s.
Looking at the weekly chart, I doubt we see much under 500 going forward, before massive new bull market launches in earnest sometime over the next 3 years or so....
DOW Weekly 1926-1954

SOX Today

The strength of Government lies in the people's ignorance, and the Government knows this, and will therefore always oppose true enlightenment. - Leo Tolstoy
Volume Dynamics Specialist
Posted 04 May 2016 - 09:57 AM
Really going to depend on how it consolidates...
There are 200 chip companies today in the World...
By 2030, that's going to be down to about 20.
Only a few names will survive, but Intel will be one of them.
Member

Posted 04 May 2016 - 12:18 PM
This SOXX chart says it all here.... it is right at support at 638, and falling under takes it to S1 at 626 and S2 at 608.
As you can see there is a zone of unstable price underneath and nothing to stop it...
So they need like 640+ here or else...
You are right on. I use the SMH to show support and resistance in the Semi Index...
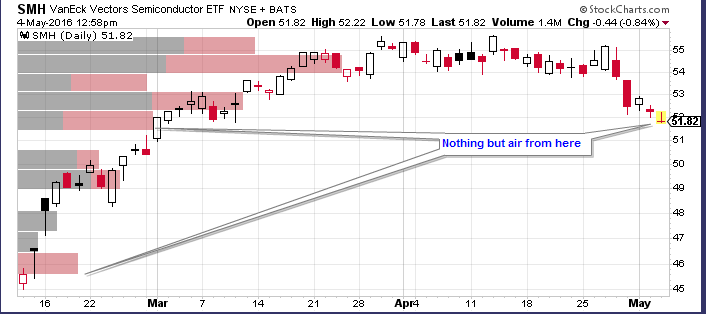
And its right at lower support and once it breaks we should see a full retracement from the Feb rally.
Volume Dynamics Specialist
Posted 04 May 2016 - 01:04 PM
Yes, but ETF's are the WORST POSSIBLE read on anything...
Go to the source, use the index, go to the instrument with the STRONGEST VOLUME...
The Index.
Volume Dynamics Specialist
Posted 04 May 2016 - 02:07 PM
SOXX Fresh Intraday Lows in Volatility Window...
Lower lows into close now after 3:15
S1 at 628 here we come...
![]()
Member
Posted 04 May 2016 - 02:22 PM
Yes, but ETF's are the WORST POSSIBLE read on anything...
Go to the source, use the index, go to the instrument with the STRONGEST VOLUME...
The Index.
Stockcharts doesnt give me Volume by Price for the SOX.
Volume Dynamics Specialist
Posted 04 May 2016 - 02:31 PM
You don't always need volume, everything I pointed out there refers to price behavior in a price range....
Easy to see once you isolate the price with the horizontal lines across the page...
And even if you don't have the volume on the SOX, you can look at the composite volume and cross-reference.
You still want the vehicle with the highest volumes to give you the largest possible sample for best accuracy...


