Jim Curryemail me: jcurry@cycle-wave.comwebsite link: www.cyclewave.homestead.comDisclaimer:The financial markets are risky. Investing is risky. Past performance does not guarantee future performance. The foregoing has been prepared solely for informational purposes and is not a solicitation, or an offer to buy or sell any security. Opinions are based on historical research and data believed reliable, but there is no guarantee that future results will be profitable. The methods Used to form opinions are highly probable and as you follow them for some time you can gain confidence in them. The Market can and will do the unexpected, use the sell stops provided to assist in risk avoidance. Not responsible for errors or omissions.
About Market Turns and Market Charts:Jim Curry is a trading systems designer and day trader and edits Market Turns cyclic advisory. Market Turns advisory service specializes in cyclical analysisand defining market turning points, using cycles, Gann analysis, Harmonics, Elliott-wave, and technical statistics.Each week he discusses when each cycle is likely to peak or trough, how far we are in the trading cycle, also what price projections are likely to be hit while the cycle progresses. Knowing these periods of projected strength or weakness - days, weeks, and even months in advance is the most valuable information you can have as a short-term trader. Larry Tomlinson has been involved in technical analysis of the Markets since 1986. His system of four technical methods combined with the five Market Risk Models allow the investor to minimize loss of capital during periods of high risk to market declines. Assets are moved into secure Money Markets during high risk and as risk improves and technical methods confirm, assets are returned to the Markets.Market Charts analysis is based on four methods. Larry uses two systems of cycle timing, Elliott wave to understand where we are in a market pattern, Fibonacci price relationships and some Gann methods to complete the system. Market risk management models are then looked at to suggest an asset allocation. This gives the individual investor information and a better understanding of how to minimize loss of profits gained in bull markets (higher highs-higher lows) by being aware of risk. A greater total return is realized due to low exposure in declining markets and aggressive exposure during low risk markets.Bob Nicholas does the market breadth analysis for the primary trend of the market using the McClellan oscillator and the intermediate breadth momentum oscillator. His analysis of the health of market breadth will keep trend traders on the right side of the market.The team of Larry, Jim and Bob provides the information for a life time of risk management of your retirement accounts, switch fund trading for intermediate term swings, futures trading for day trading including all the tools required for beginners and experts on the floor.
What you get:An e-mail subscription to Market Charts/Market Turns provides the following two levels of service: Weekly and Daily.
Weekly Commentary- Long term risk models for 401K and IRA management
- A weekly Dow and Sp500 chart and analysis summary by 6 PM Sunday
- Six to eight charts with technical commentary using Elliott, Gann and Japanese charting methods
- A weekly Long Term Market Risk Management summary as conditions merit
- Market Turns Cyclic model look ahead for future cycle turns
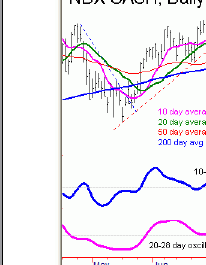
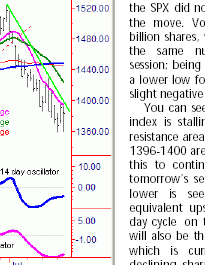
Daily CommentaryDaily charts and analysis of the SP-500 futures, NDZ Daily 60 minute chart of the S&P 500 with analysis Daily Support and Resistance Table of the S&P 500 index Market Turns analysis of short term cycles and our exclusive "CYCLE OSCILLATOR" Primary Trend model for switch fund traders Short term Trend model for day trading Real time analysis and day trading using the cycles and Trend Models Pre Open analysis and comments for the days trading, support and resistance levels, market pattern for the day Daily NYSE breadth analysis of the McClellan Oscillator and the Intermediate-Term Breadth Momentum Oscillator (ITBM) for trend traders.
