Jump to content


Photo

Caution is warranted.


  • Please log in to reply
40 replies to this topic

#21 MDurkin

MDurkin

    Member

  • Traders-Talk User
  • 638 posts

Posted 09 July 2016 - 02:02 PM


Dave what's your thoughts on Treasury's... usually they go up when the market goes up... not now?


Not sure on your question as all four of the major asset classes are rising simultaneously since we have record amounts of cash in the global financial system (gold, commodities, debt, equities).


It's like a lake at flood stage and even the bypasses are overflowing...until it starts to recede (higher rates), you won't see the natural ebb and flows of liquidity as it moves from one asset class to the other.


At this stage though, as long as money continues to support the interest rate sensitive areas of the markets, this PROMISES us higher equity prices in the not too distant future.


If I missed the basis of your question, if you could post a chart or provide a follow up, and I would be glad to address it.


Fib


Take the last 2 bear markets(2000-2003)-(2007-2009) as the stock market tanked the 30 year Treasury's yield dropped... flight to safety. Now you have the market rising and Treasury's yields dropping the opposite of what happened. Why?


Thanks.


#22 fib_1618

fib_1618

    Member

  • Traders-Talk User
  • 10,145 posts

Posted 09 July 2016 - 02:31 PM

Since that will never happen, you are saying this bubble will never end. It will never happen as the reason its not going up is the amount owed yearly on interest yearly is already too much (like 15% of total GDP), and debt is going up parabolically. Rates will go negative at some point in the US.


Anyone who has been trading the markets for any length of time knows that there will always be some sort of fundamental worry that will keep you from making money on a consistent basis. The market makers bank on this emotionalism each and every day. This is why some turn to technical analysis as it provides the necessary insight to execute trades without second guessing yourself. Unfortunately though, these same people either don't fully take the time to understand (analytically) their choice of indicators, to trust what they show, or allow their "instincts" to keep them from their objective in making profits and cutting losses.


It's important to remember in all of this is that prices for any product can only rise and fall based solely on monetary supply and demand. The lower the cost of (investment) capital, the more there is to put to work. Increase the cost of capital, and most areas of investment (or purchase) struggle. So as long as the cost of money is cheap and plentiful, not only will it seek out the best areas of total return, but it will also expand into areas of which don't deserve this same support (junk bonds, pink sheets, etc...or even impulse buying at the cash register). This is the basis of Keynesian economics, and as long as Global Treasury Departments continue to support this economic theory, this is what we're left to work with...good or bad...with the underlying ugliness only shown once the make up kit is taken away.


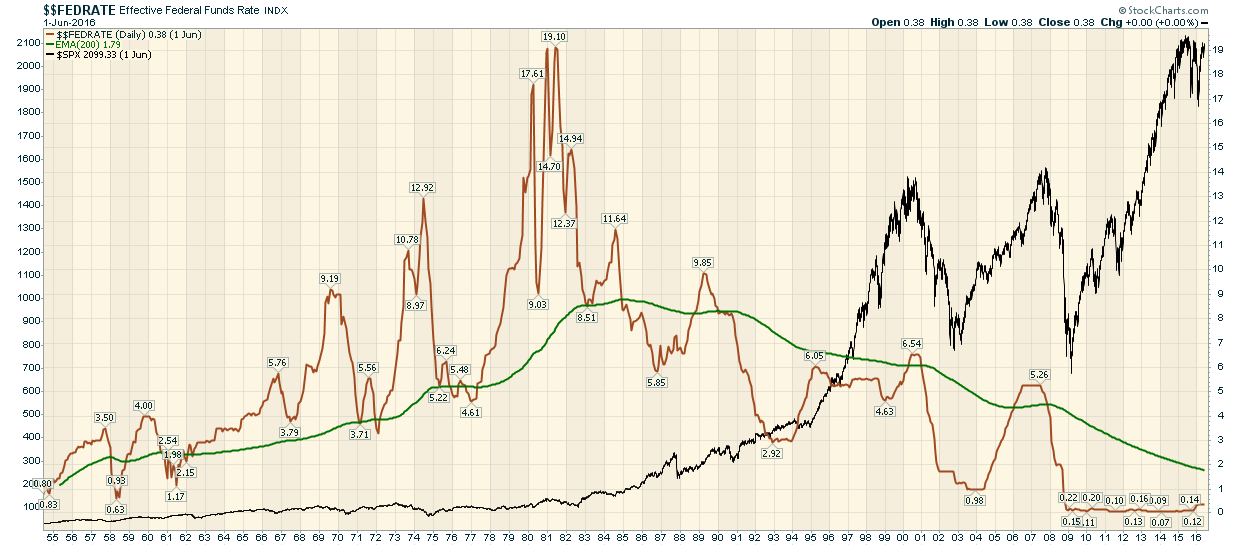
Anyway...I pulled together a FED Funds chart for you to review to reach your own conclusions...you can see that anytime the rate is above its 200 month EMA, the stock market suffocates, below it and it prospers ...bubbles be damned.


Fib


Better to ignore me than abhor me.

“Wise men don't need advice. Fools won't take it” - Benjamin Franklin


"Beware of false knowledge; it is more dangerous than ignorance" - George Bernard Shaw


Demagogue: A leader who makes use of popular prejudices, false claims and promises in order to gain power.

Technical Watch Subscriptions


#23 Rogerdodger

Rogerdodger

    Member

  • TT Member*
  • 26,872 posts

Posted 09 July 2016 - 02:33 PM

"It's all about the BASS, bout that bass, no treble!"

 (pushing on the liquidity string is storing up problems for the future)


McCellan

NIRP Disrupting 60-Year Cycle

The 60-year cycle in interest rates has been operating for as long as interest rate data have reliably been collected.  And right now it is saying that we should be in an upward trend for interest rates, lasting until 2040.  So the negative interest rate policy (NIRP) being foisted upon us by the smart people who run the world’s central banks is running contrary to that cycle, and thus is storing up problems for the future.  Delaying the inevitable just makes the inevitable that much more painful once it gets here.


Edited by Rogerdodger, 09 July 2016 - 02:38 PM.


#24 fib_1618

fib_1618

    Member

  • Traders-Talk User
  • 10,145 posts

Posted 09 July 2016 - 03:02 PM

Take the last 2 bear markets (2000-2003)-(2007-2009) as the stock market tanked the 30 year Treasury's yield dropped... flight to safety. Now you have the market rising and Treasury's yields dropping the opposite of what happened. Why?


The simple answer is that you had economic expansion during the two prior topping phases and where the Fed raised interest rates to provide a "braking effect" to any inflationary expectations that go along with it. Once interest rates became too high though, it strangled investment capital as the cost of money became more expensive, less and less equity issues were supported, and the "market" became "overvalued" and price decay ensued. Right now, we don't have this...not only does the FED have the monetary spigot on full blast because we're in a disinflationary recession (whether or not they wish to admit it), but we also have other global money center banks offering negative rates of return and forcing capital to invest into the four major asset classes to keep things from collapsing...with real estate as an investment kicker to such policies and giving many a (true) false sense of security of what's really going on behind the curtain. How long will this last is anyone's guess. But history has shown that as long as monetary policy remains fluid, money will continue to move into any or all areas that it deems "undervalued" until there isn't anything left to invest in....and down we go.


Just follow cumulative money flow...as long as demand is there, there will be limited supply offered, and prices will have nowhere else to go but up in spite of any fear mongering that you might hear.


Fib


Better to ignore me than abhor me.

“Wise men don't need advice. Fools won't take it” - Benjamin Franklin


"Beware of false knowledge; it is more dangerous than ignorance" - George Bernard Shaw


Demagogue: A leader who makes use of popular prejudices, false claims and promises in order to gain power.

Technical Watch Subscriptions


#25 MDurkin

MDurkin

    Member

  • Traders-Talk User
  • 638 posts

Posted 09 July 2016 - 04:46 PM


Take the last 2 bear markets (2000-2003)-(2007-2009) as the stock market tanked the 30 year Treasury's yield dropped... flight to safety. Now you have the market rising and Treasury's yields dropping the opposite of what happened. Why?


The simple answer is that you had economic expansion during the two prior topping phases and where the Fed raised interest rates to provide a "braking effect" to any inflationary expectations that go along with it. Once interest rates became too high though, it strangled investment capital as the cost of money became more expensive, less and less equity issues were supported, and the "market" became "overvalued" and price decay ensued. Right now, we don't have this...not only does the FED have the monetary spigot on full blast because we're in a disinflationary recession (whether or not they wish to admit it), but we also have other global money center banks offering negative rates of return and forcing capital to invest into the four major asset classes to keep things from collapsing...with real estate as an investment kicker to such policies and giving many a (true) false sense of security of what's really going on behind the curtain. How long will this last is anyone's guess. But history has shown that as long as monetary policy remains fluid, money will continue to move into any or all areas that it deems "undervalued" until there isn't anything left to invest in....and down we go.


Just follow cumulative money flow...as long as demand is there, there will be limited supply offered, and prices will have nowhere else to go but up in spite of any fear mongering that you might hear.


Fib


OK thanks.


#26 claire

claire

    Member

  • Traders-Talk User
  • 649 posts

Posted 09 July 2016 - 05:59 PM

Fib, thanks for posting your insight on critical factors influencing the dynamics of the markets.  It's very helpful in clearing the fog.  I'm holding my breathe, hoping there are no contentious comments which drive you away from posting.


#27 fib_1618

fib_1618

    Member

  • Traders-Talk User
  • 10,145 posts

Posted 09 July 2016 - 06:41 PM

I see that Stock Charts has compressed the Fed Funds chart I posted above...here's the unadulterated version for the readers review.


Fib
 

fedfunds070816.png


Better to ignore me than abhor me.

“Wise men don't need advice. Fools won't take it” - Benjamin Franklin


"Beware of false knowledge; it is more dangerous than ignorance" - George Bernard Shaw


Demagogue: A leader who makes use of popular prejudices, false claims and promises in order to gain power.

Technical Watch Subscriptions


#28 diogenes227

diogenes227

    Member

  • TT Patron+
  • 5,120 posts

Posted 09 July 2016 - 08:09 PM

I see that Stock Charts has compressed the Fed Funds chart I posted above...here's the unadulterated version for the readers review.


Fib
 

fedfunds070816.png


What's another name for that green line?  The "between" between the rock and the hard place?


"If you've heard this story before, don't stop me because I'd like to hear it again," Groucho Marx (on market history?).

“I've learned in options trading simple is best and the obvious is often the most elusive to recognize.”


"The god of trading rewards persistence, experience and discipline, and absolutely nothing else."


#29 fib_1618

fib_1618

    Member

  • Traders-Talk User
  • 10,145 posts

Posted 09 July 2016 - 08:44 PM


I see that Stock Charts has compressed the Fed Funds chart I posted above...here's the unadulterated version for the readers review.


Fib
 

fedfunds070816.png


What's another name for that green line?  The "between" between the rock and the hard place?


How about "the solution to the question never asked"?


Fib


Better to ignore me than abhor me.

“Wise men don't need advice. Fools won't take it” - Benjamin Franklin


"Beware of false knowledge; it is more dangerous than ignorance" - George Bernard Shaw


Demagogue: A leader who makes use of popular prejudices, false claims and promises in order to gain power.

Technical Watch Subscriptions


#30 claire

claire

    Member

  • Traders-Talk User
  • 649 posts

Posted 09 July 2016 - 11:38 PM

Isn't the green line the 200 ema of the fed rate?