
Fed Support
Started by
diogenes227
, Aug 19 2016 02:37 PM
6 replies to this topic
#1

diogenes227
-
- TT Patron+
- 5,120 posts
Member
Posted 19 August 2016 - 02:37 PM
"If you've heard this story before, don't stop me because I'd like to hear it again," Groucho Marx (on market history?).
“I've learned in options trading simple is best and the obvious is often the most elusive to recognize.”
"The god of trading rewards persistence, experience and discipline, and absolutely nothing else."
#2
fib_1618
-

- Traders-Talk User
- 10,145 posts
Member
Posted 19 August 2016 - 02:44 PM
I'm not too sure which part of the photo I'm supposed to be looking at. 
Fib
Better to ignore me than abhor me.
“Wise men don't need advice. Fools won't take it” - Benjamin Franklin
"Beware of false knowledge; it is more dangerous than ignorance" - George Bernard Shaw
Demagogue: A leader who makes use of popular prejudices, false claims and promises in order to gain power.
Technical Watch Subscriptions
#3
diogenes227
-
- TT Patron+
- 5,120 posts
Member
Posted 19 August 2016 - 03:16 PM
I'm not too sure which part of the photo I'm supposed to be looking at.
Fib
")
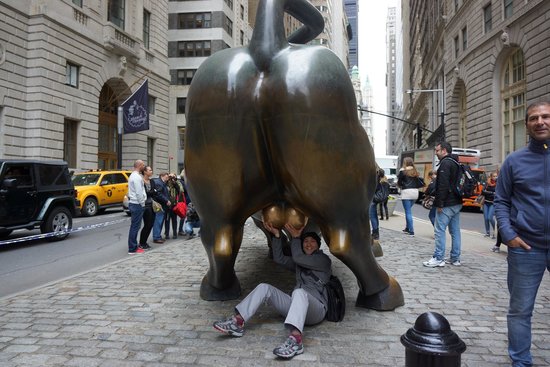
Hmm...it appears they may have enlisted a Chinese fellow to do the heavy lifting...
By the way, Fib, I can't remember when, if ever, the market -- i.e. SPY, QQQ, IWM -- have defied a falling NYSI for this long (more than three trading weeks). What do you make of that?
"If you've heard this story before, don't stop me because I'd like to hear it again," Groucho Marx (on market history?).
“I've learned in options trading simple is best and the obvious is often the most elusive to recognize.”
"The god of trading rewards persistence, experience and discipline, and absolutely nothing else."
#4
fib_1618
-
- Traders-Talk User
- 10,145 posts
Member
Posted 19 August 2016 - 03:37 PM
I'm not too sure which part of the photo I'm supposed to be looking at.
Fib
Hmm...it appears they may have enlisted a Chinese fellow to do the heavy lifting...
By the way, Fib, I can't remember when, if ever, the market -- i.e. SPY, QQQ, IWM -- have defied a falling NYSI for this long (more than three trading weeks). What do you make of that?
It's pretty common actually.
(Note that bearish trends are in parenthesis in the next paragraph)
Remember that the MCSUM measures the difference in the distance between the 19 day and 39 day EMA's in relation to the cumulative A/D or U/D lines being measured. So if we extend this idea to that of a price chart, if a shorter term EMA is still above (or below) the intermediate term EMA, prices do continue to ride the trend laid out by the support (or resistance) of these same trending EMA's. This is why prices can continue to be buoyant (or remain under pressure) during times in which the MCSUM is declining (or advancing) from levels greater than the750 level (in either direction), and why, we usually see higher price highs (or lower lows) during times when the MCSUM later turns up (or down) at or near the zero line - providing negative (or positive) divergence - before prices actually top (or bottom) out, and a reversal of trend can then get underway.
Fib
Better to ignore me than abhor me.
“Wise men don't need advice. Fools won't take it” - Benjamin Franklin
"Beware of false knowledge; it is more dangerous than ignorance" - George Bernard Shaw
Demagogue: A leader who makes use of popular prejudices, false claims and promises in order to gain power.
Technical Watch Subscriptions
#5
diogenes227
-
- TT Patron+
- 5,120 posts
Member
Posted 19 August 2016 - 03:52 PM
I'm not too sure which part of the photo I'm supposed to be looking at.
Fib
Hmm...it appears they may have enlisted a Chinese fellow to do the heavy lifting...
By the way, Fib, I can't remember when, if ever, the market -- i.e. SPY, QQQ, IWM -- have defied a falling NYSI for this long (more than three trading weeks). What do you make of that?
It's pretty common actually.
(Note that bearish trends are in parenthesis in the next paragraph)
Remember that the MCSUM measures the difference in the distance between the 19 day and 39 day EMA's in relation to the cumulative A/D or U/D lines being measured. So if we extend this idea to that of a price chart, if a shorter term EMA is still above (or below) the intermediate term EMA, prices do continue to ride the trend laid out by the support (or resistance) of these same trending EMA's. This is why prices can continue to be buoyant (or remain under pressure) during times in which the MCSUM is declining (or advancing) from levels greater than the750 level (in either direction), and why, we usually see higher price highs (or lower lows) during times when the MCSUM later turns up (or down) at or near the zero line - providing negative (or positive) divergence - before prices actually top (or bottom) out, and a reversal of trend can then get underway.
Fib
By saying "it's pretty common actually", I'm assuming you are referring to the Price/MCSUM behavior and not the enlisting of Chinese fellow to hold up the bull.
Thanks again for the McClellan refresher and insight.
Best to you.
"If you've heard this story before, don't stop me because I'd like to hear it again," Groucho Marx (on market history?).
“I've learned in options trading simple is best and the obvious is often the most elusive to recognize.”
"The god of trading rewards persistence, experience and discipline, and absolutely nothing else."
#6
fib_1618
-
- Traders-Talk User
- 10,145 posts
Member
Posted 19 August 2016 - 05:47 PM
I'm not too sure which part of the photo I'm supposed to be looking at.
Fib
Hmm...it appears they may have enlisted a Chinese fellow to do the heavy lifting...
By the way, Fib, I can't remember when, if ever, the market -- i.e. SPY, QQQ, IWM -- have defied a falling NYSI for this long (more than three trading weeks). What do you make of that?
It's pretty common actually.
(Note that bearish trends are in parenthesis in the next paragraph)
Remember that the MCSUM measures the difference in the distance between the 19 day and 39 day EMA's in relation to the cumulative A/D or U/D lines being measured. So if we extend this idea to that of a price chart, if a shorter term EMA is still above (or below) the intermediate term EMA, prices do continue to ride the trend laid out by the support (or resistance) of these same trending EMA's. This is why prices can continue to be buoyant (or remain under pressure) during times in which the MCSUM is declining (or advancing) from levels greater than the750 level (in either direction), and why, we usually see higher price highs (or lower lows) during times when the MCSUM later turns up (or down) at or near the zero line - providing negative (or positive) divergence - before prices actually top (or bottom) out, and a reversal of trend can then get underway.
Fib
By saying "it's pretty common actually", I'm assuming you are referring to the Price/MCSUM behavior and not the enlisting of Chinese fellow to hold up the bull.
Money is money...money is fuel...the market cares not where it comes from, only that it's there to be used to fight off the bear market default.
You're welcome.
Fib
Better to ignore me than abhor me.
“Wise men don't need advice. Fools won't take it” - Benjamin Franklin
"Beware of false knowledge; it is more dangerous than ignorance" - George Bernard Shaw
Demagogue: A leader who makes use of popular prejudices, false claims and promises in order to gain power.
Technical Watch Subscriptions
#7
gm_general
-

- TT Member+
- 1,653 posts
Member
Posted 20 August 2016 - 01:24 PM
Did you happen to see what they did with those on Mr. Robot? Just goes to show you sometimes the bull gets his ^%$ cut off when he least expects it.


