Jump to content


Photo

2016 SPX Roadmap Update


  • Please log in to reply
9 replies to this topic

#1 kssmibotm

kssmibotm

    Member

  • Traders-Talk User
  • 653 posts

Posted 01 October 2016 - 12:25 PM

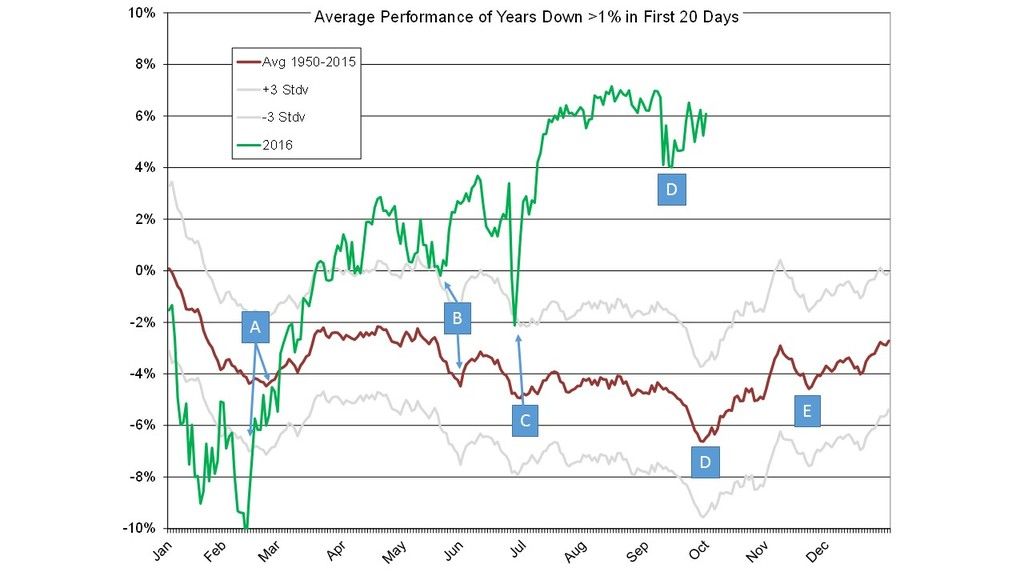
According to the seasonal analog (based on the average SPX performance in years where the market was down 1% or more in the first 20 days of year) a seasonal low was expected on Tuesday, Oct 4.  Unless we see a big selloff next week, it appears that the seasonal low (point D) occurred on Sep 14.  The seasonal analog will turn bullish after Oct 4, and should remain bullish the rest of the year.  The only remaining seasonal low of significance this year is projected for late November (point E). Maybe a post election hangover??  The analog suggests that low should be bought for a year end rally.


SPX%20Jan%20Big%20Decline%20Average%20Oc


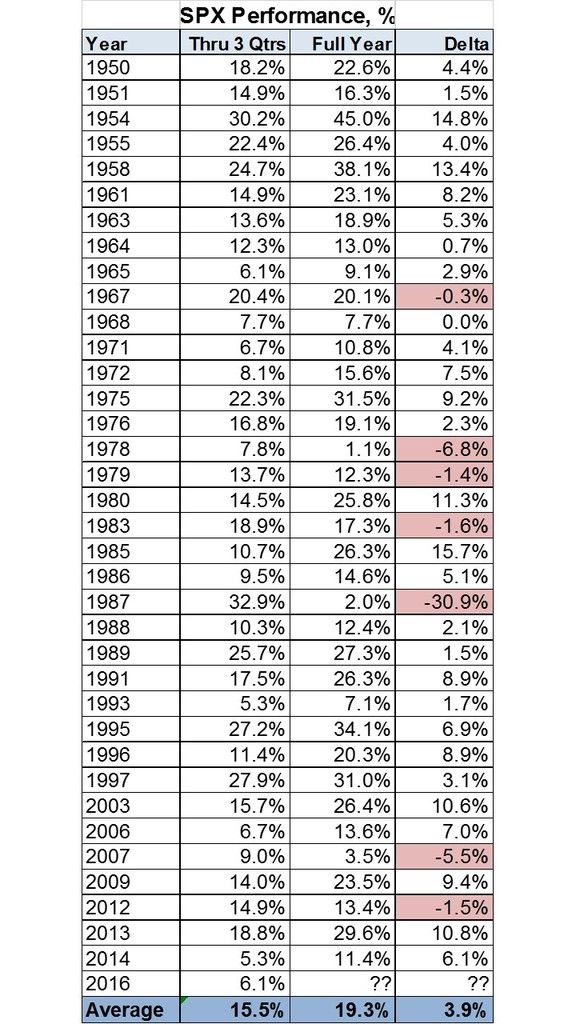
I also took a look at all years since 1950 where the SPX was up more than 5% in the first 3 quarters.  There are 36 years listed in the table below, and in 29 cases (81%), the SPX ended the year higher by an average of 3.9 percentage points.  If 2016 follows the average, the SPX will end the year with a 10% gain, putting it at 2248.


I covered all my hedges last week.  I am still long Dec puts on individual stocks like DB, BCS and other EU banks.  As always, corroborate this analysis with your own.


SPX%20Perf%20w%205%20gain%20thru%203%20q


People think the Holy Grail is something looked for but never found. In fact, it is something often found but rarely recognized.

#2 tsharp

tsharp

    Member

  • Traders-Talk User
  • 1,487 posts

Posted 01 October 2016 - 12:54 PM

I agree... my interpretation suggests the running wave-ii) ended in truncation and wave-iii) is underway for a few months... time will tell!


Chart link:  https://postimg.org/image/pxcgfnql5/


SPX_60_9_30_16.jpg


#3 tsharp

tsharp

    Member

  • Traders-Talk User
  • 1,487 posts

Posted 01 October 2016 - 12:59 PM

One more chart... this is the monthly SPX with my momentum indicator and the ATR set to NAV's 20,2 setting; as you can see, it would take a monthly closing down in the 1960 range to trigger a sell signal... I don't see that happening going into the election, add to that my wave count and the seasonality factor and I suggest it's upward from here for several months.


Chart link:  https://postimg.org/image/4g178azbt/


SPX_M_9_30_16.jpg


#4 kssmibotm

kssmibotm

    Member

  • Traders-Talk User
  • 653 posts

Posted 01 October 2016 - 02:36 PM

I agree... my interpretation suggests the running wave-ii) ended in truncation and wave-iii) is underway for a few months... time will tell!


I am no ewave expert, but several ewaver's I follow are showing similar counts.  SPX needs to breakout to new highs to confirm.


People think the Holy Grail is something looked for but never found. In fact, it is something often found but rarely recognized.

#5 dasein

dasein

    Member

  • Traders-Talk User
  • 7,696 posts

Posted 02 October 2016 - 09:29 AM

looks like it could be a bear flag or symetrical triangle - would wait for confirmation....


best,
klh

#6 K Wave

K Wave

    Member

  • Traders-Talk User
  • 26,666 posts

Posted 02 October 2016 - 11:13 AM

Of course, completely disregarding the fact the the index is currently waaayy above the 3 std deviation line....watch out for October mean reversion IF bulls are not able take it out the top next week.....


SPX 2150 is the huge pivot going forward...a breach of 2162 on Monday could be first sign bulls don't have what it takes....


In the mean time, bulls till have the ball at this point....


The strength of Government lies in the people's ignorance, and the Government knows this, and will therefore always oppose true enlightenment. - Leo Tolstoy


#7 tsharp

tsharp

    Member

  • Traders-Talk User
  • 1,487 posts

Posted 02 October 2016 - 11:43 AM

Bubbles never make sense... who in their right mind would pay as much as ten year's worth of wages for a single tulip bulb?  https://en.wikipedia...iki/Tulip_mania


They are what they are... just recognize it and prepare for what's on the other side!


#8 kssmibotm

kssmibotm

    Member

  • Traders-Talk User
  • 653 posts

Posted 02 October 2016 - 12:09 PM

Of course, completely disregarding the fact the the index is currently waaayy above the 3 std deviation line....


On what time frame and moving average is the SPX above the +3 std dev?  It is below the +1 std dev on the daily chart with a 20 mav.


People think the Holy Grail is something looked for but never found. In fact, it is something often found but rarely recognized.

#9 kssmibotm

kssmibotm

    Member

  • Traders-Talk User
  • 653 posts

Posted 02 October 2016 - 12:22 PM


Of course, completely disregarding the fact the the index is currently waaayy above the 3 std deviation line....


On what time frame and moving average is the SPX above the +3 std dev?  It is below the +1 std dev on the daily chart with a 20 mav.


Sorry, I just realized you are referring to my chart.  The SPX has spent so much time above the +3 std dev band in 2016 that I doubt there will be a mean reversion.  I am only using the analog to identify seasonal lows.


People think the Holy Grail is something looked for but never found. In fact, it is something often found but rarely recognized.

#10 gm_general

gm_general

    Member

  • TT Member+
  • 1,653 posts

Posted 02 October 2016 - 10:15 PM

Then there's this: