Jump to content


Photo

head and shoulders top


  • Please log in to reply
8 replies to this topic

#1 tradesurfer

tradesurfer

    Member

  • Traders-Talk User
  • 2,944 posts

Posted 15 October 2016 - 09:51 AM

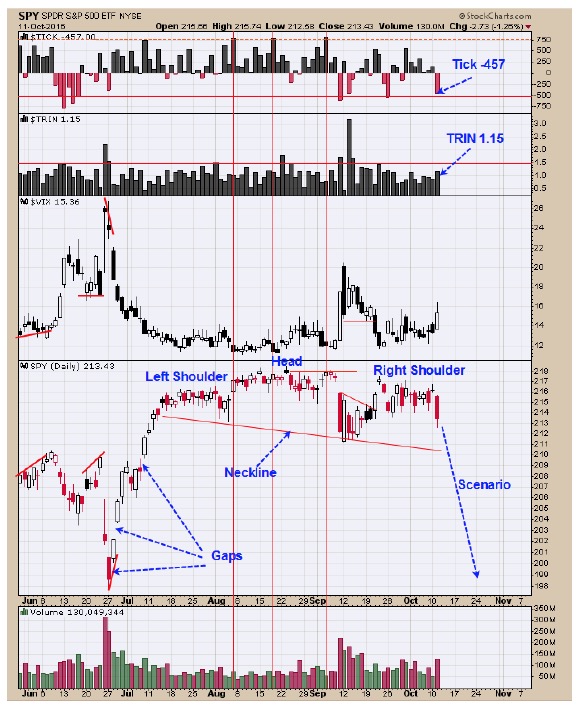
I had not really noticed this H&S top in sp500 until I saw this article.  I was not really able to identify it because the trading range was so narrow.


This author says the pattern exists from July 14th onward.


http://www.seeitmark...ks-lower-16144/


If true then we are in for a world of hurt right into the election.  The market is going to decide the election !


#2 pdx5

pdx5

    I want return OF my money more than return ON my money

  • Traders-Talk User
  • 9,527 posts

Posted 15 October 2016 - 03:34 PM

Magnitudes of price ranges are too small to be a significant H&S....JMHO.


"Money cannot consistently be made trading every day or every week during the year." ~ Jesse Livermore Trading Rule

#3 fib_1618

fib_1618

    Member

  • Traders-Talk User
  • 10,145 posts

Posted 15 October 2016 - 08:23 PM

Where's the daily volume on the chart for confirmation?

Fib

Better to ignore me than abhor me.

“Wise men don't need advice. Fools won't take it” - Benjamin Franklin


"Beware of false knowledge; it is more dangerous than ignorance" - George Bernard Shaw


Demagogue: A leader who makes use of popular prejudices, false claims and promises in order to gain power.

Technical Watch Subscriptions


#4 Rogerdodger

Rogerdodger

    Member

  • TT Member*
  • 26,872 posts

Posted 15 October 2016 - 10:16 PM

Tim Ord: The Ord Oracle October 14, 2016

Yesterday we said, “A possible scenario that may be in development is a Head and Shoulders top.  The Right 
Shoulder is forming now.  To help qualify this pattern, we would like to see volume increase on the coming potential pull back and not see panic in the tick or trin as the pull back progress.

1476462247156862824886.jpg


Edited by Rogerdodger, 15 October 2016 - 10:30 PM.


#5 fib_1618

fib_1618

    Member

  • Traders-Talk User
  • 10,145 posts

Posted 16 October 2016 - 10:18 AM

Does the volume pattern on the chart offered by Tim suggest a head and shoulders top?


Fib


Better to ignore me than abhor me.

“Wise men don't need advice. Fools won't take it” - Benjamin Franklin


"Beware of false knowledge; it is more dangerous than ignorance" - George Bernard Shaw


Demagogue: A leader who makes use of popular prejudices, false claims and promises in order to gain power.

Technical Watch Subscriptions


#6 MDurkin

MDurkin

    Member

  • Traders-Talk User
  • 638 posts

Posted 16 October 2016 - 10:49 AM

http://stockcharts.c...1107832/tenpp/5

55 S&P 500 - Weekly


This is NOT wave 3 of 5


#7 Rogerdodger

Rogerdodger

    Member

  • TT Member*
  • 26,872 posts

Posted 16 October 2016 - 04:00 PM

Ominous charts point to a crash (a la October 1987)


MW-EX822_spx_cd_20161013153902_NS.jpgMW-EX820_murray_20161013151902_NS.jpg

Market columnist Mark Hulbert says the market is setting up for a monster rally and points out that the Dow has gained an average of 6.8% from its lowest point in October through the end of that same year.

Wall Street should hope that he’s right.


Edited by Rogerdodger, 16 October 2016 - 04:04 PM.


#8 fib_1618

fib_1618

    Member

  • Traders-Talk User
  • 10,145 posts

Posted 16 October 2016 - 06:39 PM

Another chart without any volume data to confirm if the pattern is, in fact, a head and shoulders top.


What has happened to the art of price to volume charting...does it exist anymore??


Fib


Better to ignore me than abhor me.

“Wise men don't need advice. Fools won't take it” - Benjamin Franklin


"Beware of false knowledge; it is more dangerous than ignorance" - George Bernard Shaw


Demagogue: A leader who makes use of popular prejudices, false claims and promises in order to gain power.

Technical Watch Subscriptions


#9 nimblebear

nimblebear

    Welcome to the Dark Side !

  • Traders-Talk User
  • 6,062 posts

Posted 16 October 2016 - 08:23 PM

That's quaint that you feel TA actually works in a manipulated market, driven by HFT algo's.  Even quainter still, are the charts that Da Chief shows, that have no dates or years on them, and are likely from the late 90's.  


OTIS.