http://www.siliconin...?msgid=30797283

Mark S. Young

Posted 20 October 2016 - 09:17 AM
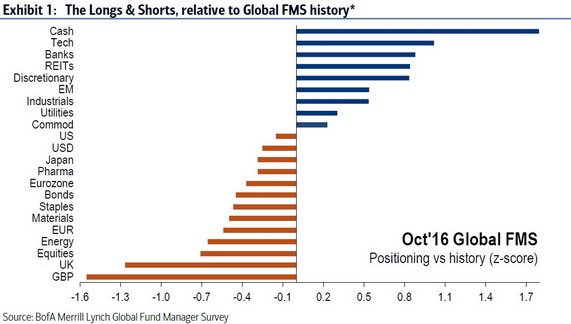
OK, a couple questions, first, is this saying that fund managers (which ones?) are holding 1.7 standard deviations more cash than is "typical" (average?)? Over what duration of time is that historical average determined?
Also, are long-term asset allocations normally distributed?
I admit, this looks LT Bullish to me, but I'd like to know how Bullish.
Mark S Young
Wall Street Sentiment
Get a free trial here:
http://wallstreetsen...t.com/trial.htm
You can now follow me on twitter
Member
Posted 20 October 2016 - 09:59 AM
just confims my idea of the coming epicenter of primary wave 3 up.....i saw the same relative cash hoards in aug 1982 when i was a broker and bears were coming out of the wall
Member

Posted 20 October 2016 - 10:12 PM
One problem with this chart is that there is not much underweight on US equities - the overweight in cash seems to be sourced from underweighting in bonds. Fund managers are already heavily overweight tech and banks. I doubt the extra cash would be put to use on low beta stocks given the ugly valuation as is across the board.
Mark S. Young
Posted 21 October 2016 - 10:14 AM
One problem with this chart is that there is not much underweight on US equities - the overweight in cash seems to be sourced from underweighting in bonds. Fund managers are already heavily overweight tech and banks. I doubt the extra cash would be put to use on low beta stocks given the ugly valuation as is across the board.
I think you're missing that this is the deviation from mean for EACH asset class. This isn't a measure of cash exposure per se. So, easily, short Equities could vastly exceed (and probably does) long Techs and Banks. In that way, it's not very revealing. We just don't know how much over and under-weighting of one or another asset class relates to other asset classes. At least from THIS data.
Mark
Mark S Young
Wall Street Sentiment
Get a free trial here:
http://wallstreetsen...t.com/trial.htm
You can now follow me on twitter
Mark S. Young
Posted 21 October 2016 - 10:17 AM
Looking at my gut, however, I suspect that the FTSE, while up, has a long way to go.
Mark
Mark S Young
Wall Street Sentiment
Get a free trial here:
http://wallstreetsen...t.com/trial.htm
You can now follow me on twitter
Volume Dynamics Specialist

Posted 21 October 2016 - 11:59 AM
When US$ Index returns 3.7% in 3 weeks, they'd be FOOLS not to build cash positions...


