http://timeandcycles.blogspot.com/
I first mentioned the 47 TD alternating cycle back on September 9 2016, when it was looking for an early September High. The 41-42 week cycle mentioned in that same post, also topped out at the same time and has an average 107 SP decline.

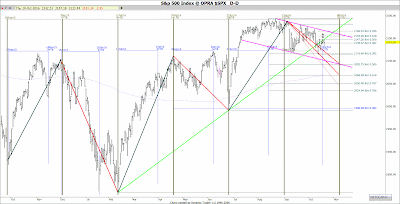
The dominant 47 TD (Trading Days) alternating High and Low cycle has been in the markets since late September 2015 and suggests a 11/08/16 Election Low, with a minimum 2093 SPX channel Target.
1. 09/29/15L - 12/02/15H, Low to High.
2. 12/02/15H - 02/11/16L, High to Low.
3. 02/11/16L - 04/20/16H, Low to High.
4. 04/20/16H - 06/27/16L, High to Low.
5. 06/27/16L – 09/07/16H, Low to High.
6. 09/07/16H – 11/08/16L, High to Low is next!
Also notice 34 TD, after the 47 TD Cycle High or Low is also a CIT (High or Low):
- 09/29/15L – 11/16/15L = 34 TD
- 12/02/15H – 01/20/16L = 32 TD
- 02/11/16H – 04/01/16H = 34 TD
- 04/20/16H – 06/08/16H = 34 TD
- 06/27/16L – 08/15/16H = 34 TD
- 09/01/16L – 10/19/16H = 33 TD

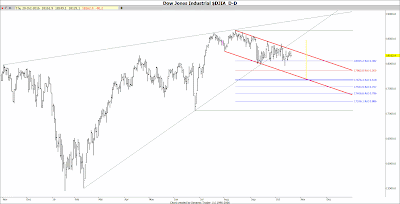
The Dow Jones down channel support touches the 61.8% retrace by 11/8. If we do the same 61.8% in the SPX we will target 2069 SPX at the 200 DMA.
Conclusion: The 34 TD CIT of the 47 TD Cycle arrived 1 day earlier at the 10/19H at 2148.44 SPX, which was a double Top with the 10/14 Apex CIT High at 2149.19 SPX. From the 10/19H, the 47 TD Cycle suggests we see a choppy decline into 11/8 election Low, targeting 2093 SPX or 2069 SPX and a strong rally afterwards.
Eric Hadik, who I've followed for many years, also does h-l geometric wave analysis and it is often useful. He claims a unique insight (it's not- Mandelbrot wrote a paper and created charts on it decades ago) of a H-L cycle progression that helps one project whether an "alternating" cycle will be a high for low. Some suggest there are separate H-L cycles. Ray Tomes has published some of the best recent work on cycles and their harmonics. (Even describing universe scale cycles!!!) The math gurus note they are infinite. Traders care mostly about the currently useful ones
Your 33 TD Correlation is a helpful, simple, and elegant visual insight. Thanks for sharing!!
FWIW a lower EWT wave 2-4 trend line projection ( a parallel of trend line between tops of a possible waves 1&3 count) from the bottom of a wave 2 would not allow much more downward movement from here if this is a wave 4 in the rise from the Feb 2016 low without invalidating a possible count having the August high as the top of wave 3 (of 5) upward and the April 2016 high as the top of Wave 1) So the depth of this correction will be very informative for the Elliott Wave counters amongst us and highly indicative of whether higher highs are ahead.
BTW, have you ever drawn the 33-34 H-L TD cycle backwards from the 47 TD H-L cycle to see what you get?? Try it and see.
I always like to compare Hurst with geometric cycle analysis. When they align provides me added confidence in the trade. Please keep posting! You're doing great work!!
ATB
Geo
Opportunity knocks on your door every day-answer it.


