Does it strike anyone else as weird that the ITBM has been on a confirmed Sell for a month while the Cumulative A/D Volume has been on a steadfast Buy since mid November?
Weird.
M
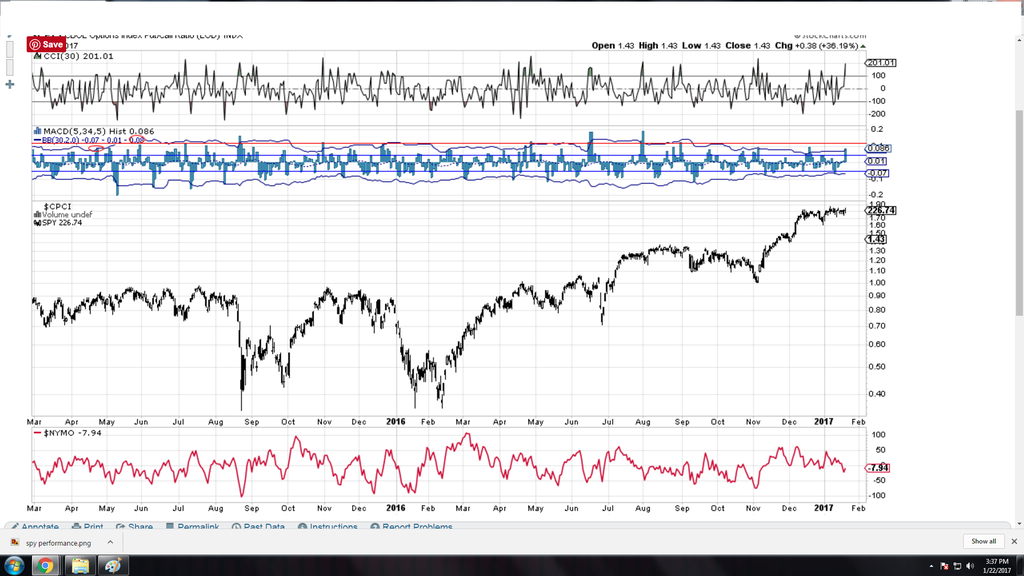
Well the market has been consolidating in a very narrow range for over a month. How did it look during another similar period. Say from 8/5/2016 - 9/8/2016?
ITBM gave a sell in late July and confirmed in early August, Cumulative A/D Volume flirted with 3 sells in August, but finally only gave one in first week of Sept. So a month isn't crazy. These ought to get in synch, though, soon. I view the Cumulative A/D as more of a "condition" indicator so I guess I haven't been looking at it for confirmation.
I'm still not clear on what parameters you're using for these "confirmed sells" as you don't have one unless this indicator moves below the zero line. If it's above the zero line, and you're using a 20 day EMA as a crossover trigger, then you only have corrective behavior - or a hold - until the zero line is violated.
I'm also wondering why you would use a momentum measurement of cumulative breadth and comparing it with raw cumulative volume...wouldn't it be better to use the ITVM?
Fib
Fib, with all due respect, I have a "confirmed sell" because I SAY I have one. My method of using the indicator is, well, mine. If I was seeking evaluation of my approach, I would provide everything I'm doing to everyone. But I'm not. I use the ITBM in one particular way, using another indicator as confirmation. It's much faster than waiting for the ITBM to cross zero. I get that the zero line was key for Carl and I know that many people use it that way. I'm not trying to get the same results that many people get, however. I don't want to discount the ITVM, either. I just selected a different tool to confirm and set of parameters and moreover, I've been fairly well pleased with it over the past couple years.
The purpose of the original post was two fold, a) to essentially crowd source a quick read on a divergence that struck me as odd (turns out it wasn't very odd at all!), and  generate some conversation. Which we are and that is good.
Philosophically, I've always been against static rules of use for any indicator. They key is to have an approach that a) works and engenders enough confidence that you'll actually take your trades. Moreover, it should be different enough from what others are doing (while still being grounded in reality and reason) so that there's still an edge. And this is a dynamic approach. It has to be. Things change in our markets over time. I remember when Sedge Coppock's breadth work was the cat's meow--a reliable and effective tool for decades. Eventually, it became nearly useless (I'm talking about his Timing Technique for Texas Traders).
Anyway, the point is, we need to be flexible and experimental as much as possible, but also disciplined.
Mark