A better BPI number would be great for the bulls.
Fib

Member
Posted 04 February 2017 - 11:43 AM
A better BPI number would be great for the bulls.
Fib
Better to ignore me than abhor me.
“Wise men don't need advice. Fools won't take it” - Benjamin Franklin
"Beware of false knowledge; it is more dangerous than ignorance" - George Bernard Shaw
Demagogue: A leader who makes use of popular prejudices, false claims and promises in order to gain power.
Technical Watch Subscriptions
Member

Posted 04 February 2017 - 11:53 AM
looks just like the gold count, 5 up off the low, wave 2 down done and now a 3rd wave up
Member

Posted 04 February 2017 - 01:37 PM
A better BPI number would be great for the bulls.
Fib
Tim

Posted 04 February 2017 - 03:02 PM
found some trading rules, Tomlinson had a rule but I dont remember.
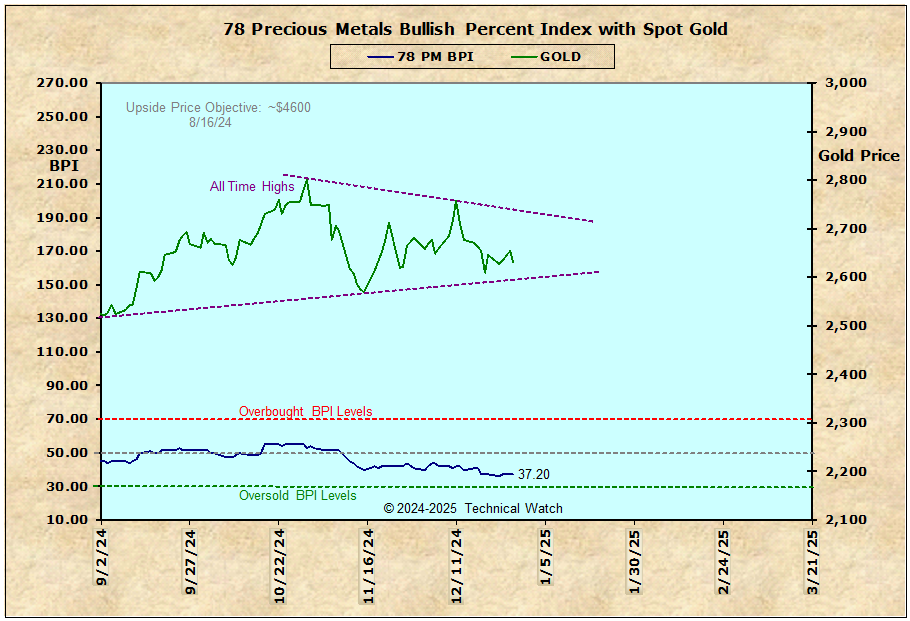
Bull alert: Corresponds with the bullish transition phase. It’s triggered when the BPI is less than 30 percent and reverses direction when 6 percent (or more) of all stocks change to buy signals.
Bull confirmed: Corresponds with the bull market phase. When the BPI indicator forms a higher high, a bull market is confirmed.
Bull correction: Corresponds with the bullish pullback phase. This condition occurs only after the BPI confirms a bull market and a minimum of 6 percent of all stocks change from buy to sell signals.
If the BPI is greater than 70 percent, this change may lead to a bear alert.
"marxism-lennonism-communism always fails and never worked, because I know
some of them, and they don't work" M.Jordan
Member
Posted 04 February 2017 - 03:48 PM
looks just like the gold count, 5 up off the low, wave 2 down done and now a 3rd wave up
As you and many others know, the beauty of Elliott is in its character rule that Elliott third waves are undeniable (wonders to behold) as to their directional trend.
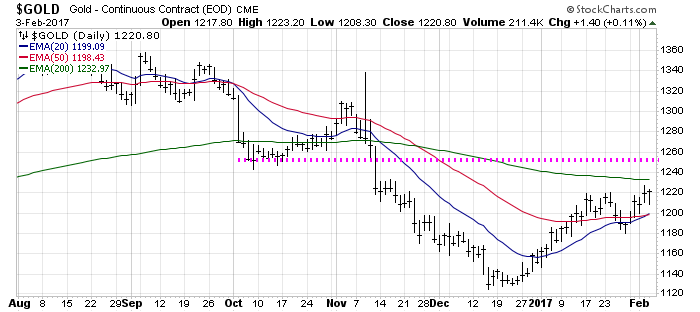
The reason for this is that all 3rd waves break above areas of major resistance...whether they be trendlines, EMA's or previous horizontal trading ranges.
In this case, not only do we have the trendline shown in the chart as a hurdle, but gold also has overhead resistance at the 200 day EMA at $1233 on the daily chart, AND we have horizontal overhead supply at the previous lows seen last October (seen in pink on the chart) at the $1250 level. So in order for prices to show 3rd wave impulsive characteristics it must have enough strength to break above all 3 of these technical hurdles in a simultaneous, "leaving no doubt" fashion. Now...if we consider that the balance of power of who's in control between buyers and sellers in the Bullish Percent Index is the 50% level, we would need to have at least a majority of PM issues showing strength in order for this kind of break out to take place. Given that the BPI is only at 42%, it would be unlikely that there's enough investment capital driving these same issues in order for gold to be labeled as 3rd wave activity at this time. Of course, we could back and fill at these resistance levels as we saw on Friday in an effort to gather more troops to do the job. But at this point, there is no strong indication that we are in a 3rd wave, and unless the A/D data holds up here, this could actually be 3rd wave's evil brother, "C" wave", and a pullback to or toward the price lows of December would likely be seen (and would compliment our none divergent bottom). Given also that the FED continues to suggest another rate hike is likely in March, and that we have the presumption that economic activity may be turning around which would support further gains in the dollar, we have to be fully cognizant of the fact that we may be topping out here, and that the next likely "buying opportunity" may not come until August.
We'll see how it goes.
Fib
Better to ignore me than abhor me.
“Wise men don't need advice. Fools won't take it” - Benjamin Franklin
"Beware of false knowledge; it is more dangerous than ignorance" - George Bernard Shaw
Demagogue: A leader who makes use of popular prejudices, false claims and promises in order to gain power.
Technical Watch Subscriptions
Member
Posted 04 February 2017 - 03:57 PM
wow Fib: fantastic analysis and thank you for your generous sharing!!One more trip to the lows or beyond would surely demoralize what few remaining gold bugs there are. So far this C up if it this that is pretty anemic even for a C. Maybe we need some more folks to buy into the 3 up hypotheis first?
Member

Posted 04 February 2017 - 04:33 PM
Thanks for your analysis Fib -- it's very helpful to me.
Member
Posted 04 February 2017 - 04:43 PM
Posted this back in May
Member

Posted 05 February 2017 - 11:30 AM
i have been shouting as loud as i could that 1229 is major resistance and the market has to take that out to prove that we are in 3. of course the alternative is C . i believe that we will take out all of the above moving averages in february. if not i will run .
march is a fascinating month . venus goes retrograde on march 4, the last time that happened was march 6of 2009 which was the bottom
of the stock market, or very very close. i think this retrograde will mark the top. and i have never seen a stock market crash that gold did not follow suit. so not a good bet. also there is netherland elections. and then the french elections ,which if le pen wins she will pull france
out of the eu. so march will be worrisome for the gold bugs. the question is from what level. if its the present level then the lows could be tested. i am a bull long term and over the next month i am bullish after that i will scale way back. i dont think new lows are in the cards but,
what i think and where i put my money may be 2 different places. what i am confident about is when the dust settles there will be some
new or old programs in place that will kick the can down the road and propel gold higher. w/the mountains of debt world wide and the globalist programs under dismantling. gold will shine. but when march approaches caution is the word . and yes i am watching all the moving averages, they are on all of my charts. and the 1229 gann marker.
dharma
Tim
Posted 05 February 2017 - 01:42 PM
I could wait for futures open before sticking my neck out,
cycles could be, 3 days up establishes the breakout, a short pause, then high in 8 days,
could mark the 1 of 3 high if it works that way.
When going into the weekly low at 5 weeks is on strong rising weekly cycle, remains to be seen what kind of low
it will be, probably a mild accumulation low.
The next weekly high is in 40 weeks, buy and hold.
"marxism-lennonism-communism always fails and never worked, because I know
some of them, and they don't work" M.Jordan


TTHQ Directory →
Market Analysis Area →
Weekly Breadth Data - 12/23/22Started by fib_1618 , 30 Dec 2022 |
|
|
||
TTHQ Directory →
Market Analysis Area →
Weekly Breadth Data - 10/28/22Started by fib_1618 , 03 Nov 2022 |
|
|
||
TTHQ Directory →
Market Analysis Area →
Weekly Breadth Data - 6/10/22Started by fib_1618 , 16 Jun 2022 |
|
|
||
TTHQ Directory →
Market Analysis Area →
Weekly Breadth Data - 5/27/22Started by fib_1618 , 03 Jun 2022 |
|
|
||
TTHQ Directory →
Market Analysis Area →
Weekly Breadth Data - 5/13/22Started by fib_1618 , 20 May 2022 |
|
|

