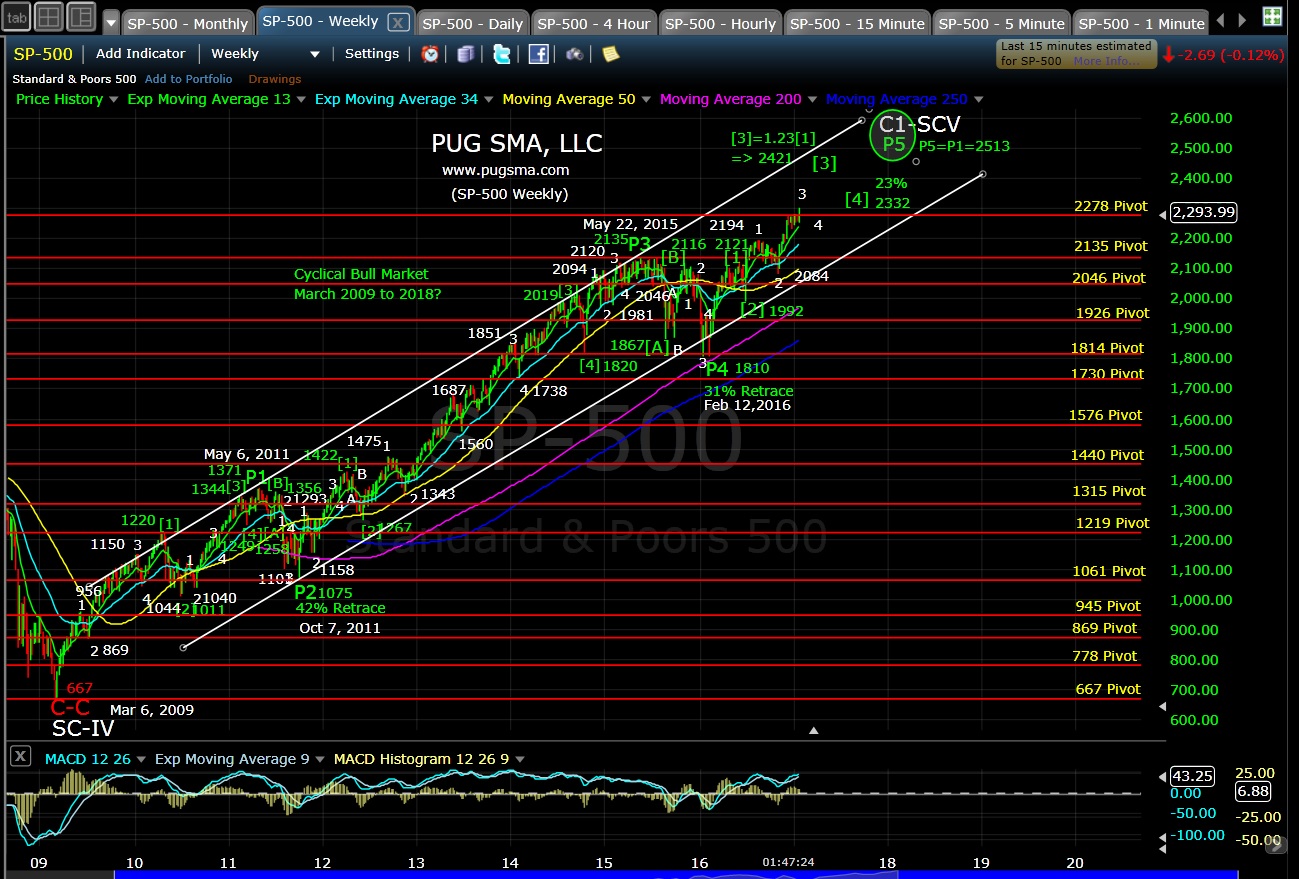
The SP-500 Elliott Wave Forecast continues to track Cycle 1 (C1) of Super Cycle V (SC-V) towards its Primary 5 (P5) = Primary 1 (P1) termination near 2513.
SP-500 Weekly Chart 1-27-17:
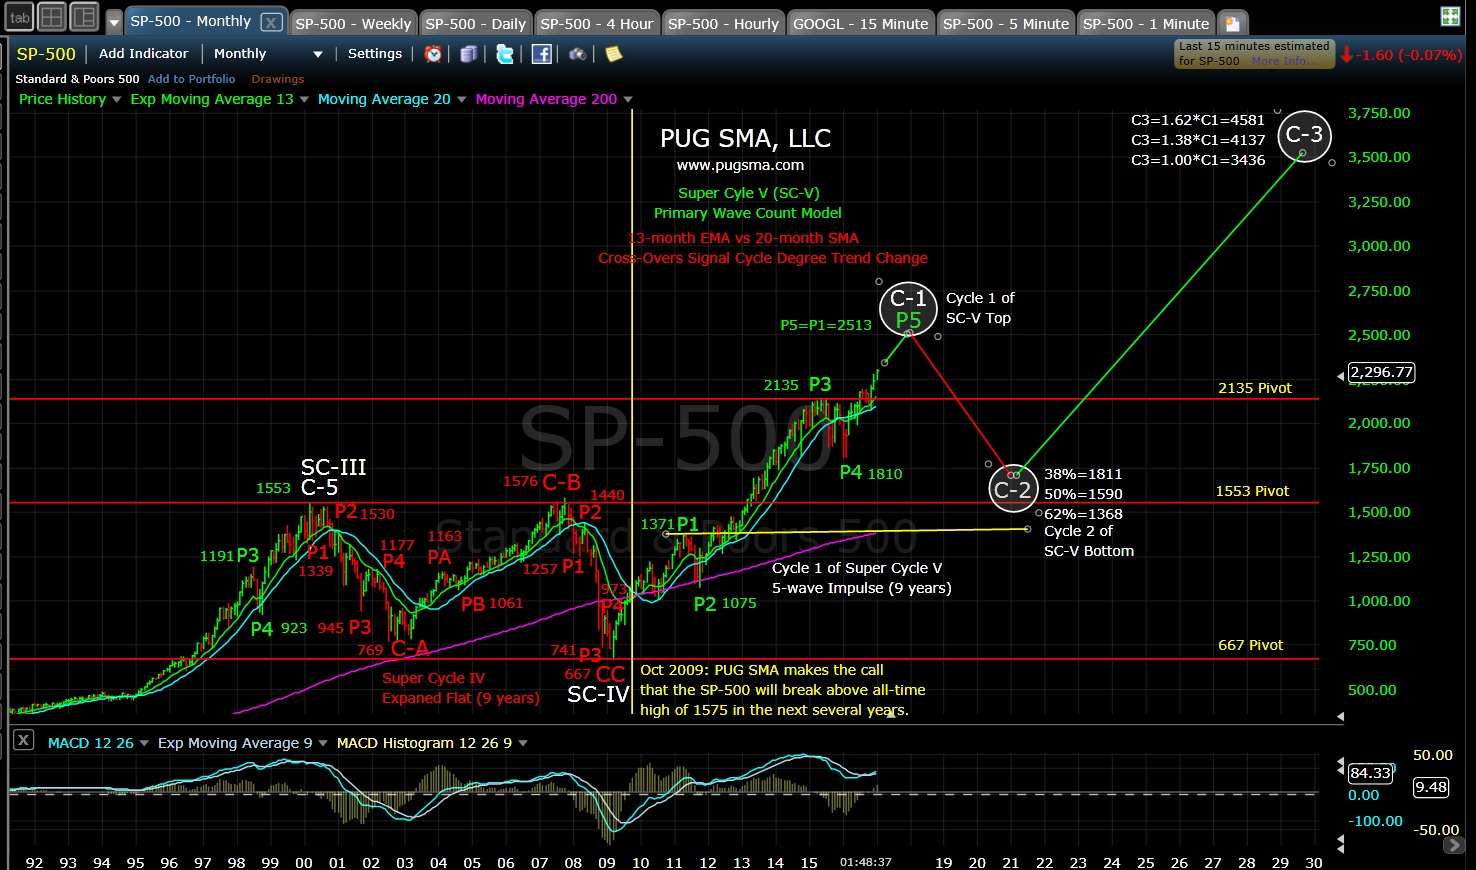
SP-500 Monthly Chart 1-27-17:

Member
Posted 12 February 2017 - 09:22 AM
The SP-500 Elliott Wave Forecast continues to track Cycle 1 (C1) of Super Cycle V (SC-V) towards its Primary 5 (P5) = Primary 1 (P1) termination near 2513.
SP-500 Weekly Chart 1-27-17:
SP-500 Monthly Chart 1-27-17:
Follow Me on Twitter @PUGStockMarket
PUG Stock Market Analysis Website
---PUG---
Tim

Posted 12 February 2017 - 04:00 PM
My Dow qtr cycle is more bullish,
highs at 2 and 7 quarters, then the big high at 4+ years,
decline from 4+ to 7 years and up well again to 11 years.
These are 200+ year cycles.
This should be historic.
"marxism-lennonism-communism always fails and never worked, because I know
some of them, and they don't work" M.Jordan
Member

Posted 13 February 2017 - 01:49 AM
Now I know what to do; now that I know what's going to happen!
I don't really mean to demean your work as I found it quite interesting and hopeful, since others are preparing for the worst. Sorry, but charts like this are not personally useful to everyday trading; even from a month to month basis. Although Ike Iossif put together some interesting arguments as to why this peak that is coming is NOT the final high in the bull. He stated that 1) the advancing AD line implies that we will need a declining AD line in the final highs, and 2) that we should be looking for higher highs that occur with higher lows in the vix before we get thrashed. That would support the potential to get to 2500 before we take our beating. Thx


