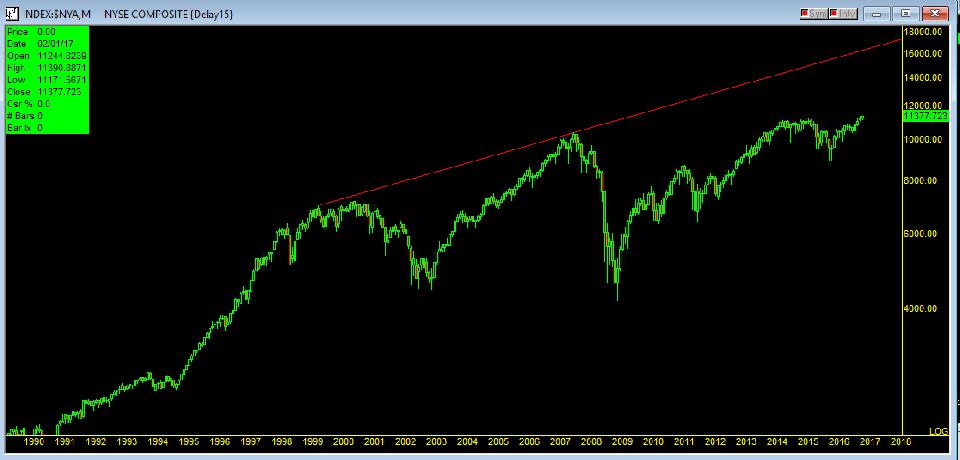
got a long way to go.....like all market indexes this one is going to its red line and exceed it
http://www.siliconin...18b3fb8ca20.jpg

Member
Posted 15 February 2017 - 07:03 AM
got a long way to go.....like all market indexes this one is going to its red line and exceed it
http://www.siliconin...18b3fb8ca20.jpg
Member

Posted 15 February 2017 - 11:45 AM
If market just goes with drawing a line at your preference, you would have been a billionaire.
I see this market is setting up for a major reversal and NYA will be moving south toward the lower trend line you omitted ..........
Edited by redfoliage2, 15 February 2017 - 11:53 AM.
Member

Posted 15 February 2017 - 12:40 PM
Or ... you are both wrong ... and we won't be going all that much farther north anytime soon.
But neither will we start anytime soon on a path toward completing that megaphone.
So I'm watching neither the sky nor the ditch. At this point.
In due time, yeah I can see a good bit higher, and then it will be time for red's call.
I'm in neither camp right here.
Edited by pedro, 15 February 2017 - 12:41 PM.
Member

Posted 15 February 2017 - 05:47 PM

No need to discuss any other charts than this one.....the NDX is likely the king over all the others. A massive cup handle formation that has already launched higher above the breakout trendline shown. A retest of the breakout has probably already occurred, the churn above the 4750 level during 2nd half of 2016. There is nothing overhead on this chart but higher and higher price levels. At this breakout level, AAPL is trading with a P/E ratio of just 13.....a raging tech bull market like this one has much further to run. See what it looks like when AAPL PE is somewhere north of 100.....
Member
Posted 15 February 2017 - 08:44 PM
If market just goes with drawing a line at your preference, you would have been a billionaire.
I see this market is setting up for a major reversal and NYA will be moving south toward the lower trend line you omitted ..........
wrong
Member
Posted 15 February 2017 - 08:48 PM
No need to discuss any other charts than this one.....the NDX is likely the king over all the others. A massive cup handle formation that has already launched higher above the breakout trendline shown. A retest of the breakout has probably already occurred, the churn above the 4750 level during 2nd half of 2016. There is nothing overhead on this chart but higher and higher price levels. At this breakout level, AAPL is trading with a P/E ratio of just 13.....a raging tech bull market like this one has much further to run. See what it looks like when AAPL PE is somewhere north of 100.....
right on.....the majority will just scalp pennies along the way. the really big money if you look at the volume that came in at the 09 lows is where the billionaires stepped up to the plate at 675 on the es
Member
Posted 15 February 2017 - 10:14 PM
as for the red line....remember this.....i didnt need trump http://www.siliconin...rchtxt=red line
Member

Posted 17 February 2017 - 12:19 PM
If market just goes with drawing a line at your preference, you would have been a billionaire.
I see this market is setting up for a major reversal and NYA will be moving south toward the lower trend line you omitted ..........
red,
I'm a ST trader so the LT charts shown don't mean much to me. A move back down to the 20 WMA will start soon based on my system.
http://stockcharts.c...564&a=507425580
We shall see how it plays out, but it's been a nice run for the bulls. I have been trading TNA and TZA picking up those pennies Cheif was talking about.
http://stockcharts.c...833&a=504861178
I'll be shorting the QQQ's as one of my next trades, and I'm making some pretty good beer money. I trade only ST extremes and this is one based on my data.... I'll be using a stop so no problem if I'm wrong.
http://stockcharts.c...538&a=507427849
http://stockcharts.c...944&a=505726870
Good trading.
Edited by robo, 17 February 2017 - 12:25 PM.
" “There is only one side to the stock market; and it is not the bull side or the bear side, but the right side” Jesse L. Livermore
Member
Posted 17 February 2017 - 12:35 PM
If market just goes with drawing a line at your preference, you would have been a billionaire.
I see this market is setting up for a major reversal and NYA will be moving south toward the lower trend line you omitted ..........
red,
I'm a ST trader so the LT charts shown don't mean much to me. A move back down to the 20 WMA will start soon based on my system.
http://stockcharts.c...564&a=507425580
We shall see how it plays out, but it's been a nice run for the bulls. I have been trading TNA and TZA picking up those pennies Cheif was talking about.
http://stockcharts.c...833&a=504861178
I'll be shorting the QQQ's as one of my next trades, and I'm making some pretty good beer money. I trade only ST extremes and this is one based on my data.... I'll be using a stop so no problem if I'm wrong.
http://stockcharts.c...538&a=507427849
http://stockcharts.c...944&a=505726870
Good trading.
http://stockcharts.c...112&a=506618635
http://stockcharts.c...278&a=507429365
http://stockcharts.c...id=p77894320331
Most of the shorts have throwing in the towel, but I'm a VST and day-trader.
http://popkey.co/m/D... the darn towel
Edited by robo, 17 February 2017 - 12:44 PM.
" “There is only one side to the stock market; and it is not the bull side or the bear side, but the right side” Jesse L. Livermore
Member
Posted 20 February 2017 - 12:05 PM
http://stockcharts.c...112&a=506618635
red,If market just goes with drawing a line at your preference, you would have been a billionaire.
I see this market is setting up for a major reversal and NYA will be moving south toward the lower trend line you omitted ..........
I'm a ST trader so the LT charts shown don't mean much to me. A move back down to the 20 WMA will start soon based on my system.
http://stockcharts.c...564&a=507425580
We shall see how it plays out, but it's been a nice run for the bulls. I have been trading TNA and TZA picking up those pennies Cheif was talking about.
http://stockcharts.c...833&a=504861178
I'll be shorting the QQQ's as one of my next trades, and I'm making some pretty good beer money. I trade only ST extremes and this is one based on my data.... I'll be using a stop so no problem if I'm wrong.
http://stockcharts.c...538&a=507427849
http://stockcharts.c...944&a=505726870
Good trading.
http://stockcharts.c...278&a=507429365
http://stockcharts.c...id=p77894320331
Most of the shorts have throwing in the towel, but I'm a VST and day-trader.
http://popkey.co/m/D... the darn towel


