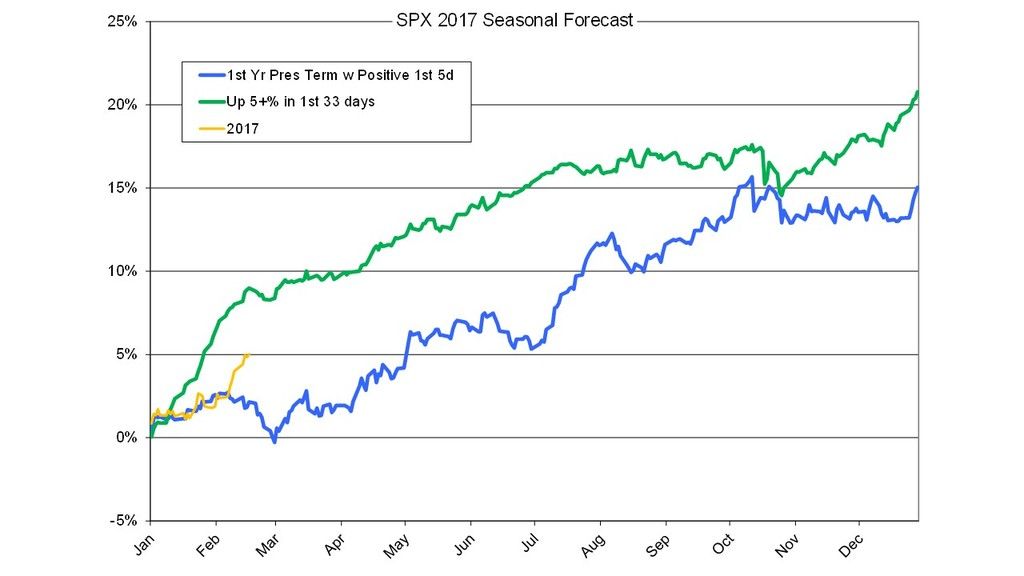
On Friday, the SPX reached a significant milestone for year-to-date performance... up 5% in the first 33 trading days. Since 1950, there have been 20 instances where the SPX was up 5% or more in the first 33 days. The years are: 1951, 1961, 1963, 1967, 1971, 1975, 1976, 1980, 1985, 1986, 1987, 1989, 1991, 1995, 1996, 1997, 1998, 2011, 2012, 2013. On average, these years finished with a gain of 21%, as shown by the green line in the chart below. Bears should note there are no significant corrections in the green forecast until October. This suggests that any small dips occurring before October should be bought. Barring a significant rise in interest rates, like 1987, it looks like smooth sailing for the stock market this year.
I am still showing the first year in presidential term forecast in blue. Although the 2017 performance is diverging from the blue line, I am not favoring one forecast over the other at this point. For now, I will use both as bookends. Let's see how long the 2017 yellow line remains between the green and blue forecast lines.
As always, never rely on a single forecast/indicator. Do your own analysis to corroborate this work.


