I have not posted much for years and partially because I was busy with a bunch of fund and technology projects (all volatility arbitrage and risk management related). Recently I started to manage hands on funds again, but I am still doing mostly risk management (with derivative overlays), not market timing, so take these with a grain of salt.
I may not be able to follow up on this post, so I kind of kept the post a bit long. At some point my trading has become very irrelevant to this board as managing the risk simply generated consistent and sufficiently high returns in my work (and given the markets), so I really didn't care about the direction of the markets, but the amount of volatility, and I stopped posting here.
I don't know about the top of this bull market, it may be years away. But a good decline is now very possible. The buy the dip conditioning has somewhat happened over the past 2 weeks and actually past 2-3 months since March.
I kept a little put spread down there at all times and some of them paid well, I sell some puts and calls to cover these costs and try to generate extra cash flow in the portfolio whenever possible. These collar strategies help a portfolio of securities to be risk-managed very well, if not they increase the return...
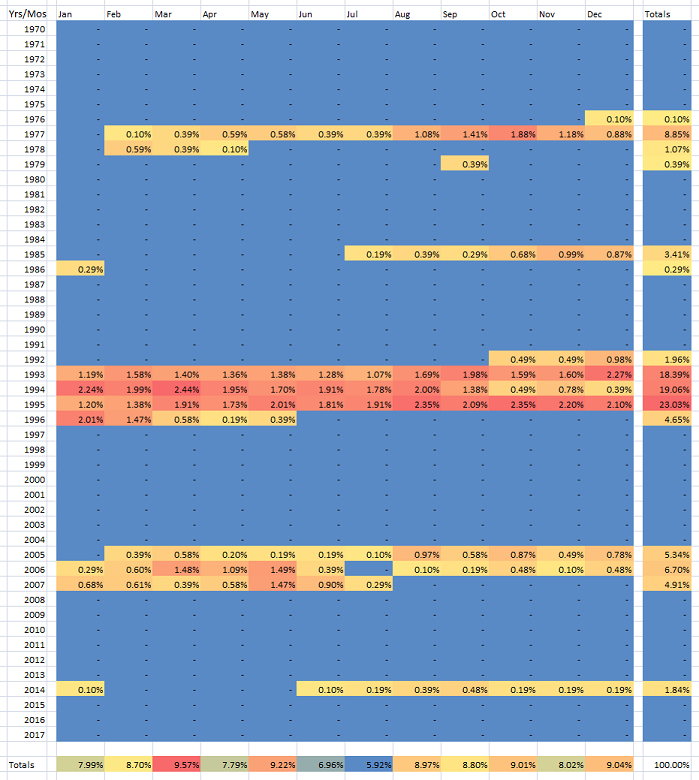
Seasonality says we have some upside potential until August, so perhaps this is going to be just another crack and the bottom will be seasonally in October. Cycles are pointing out to a potential low in June, but I think we will see something in October, potentially a cleaner low. TWT
For this current market, it closed up with NYSE printing higher risk premiums in options, very poor breadth figures, actually the breadth momentum is also turning down. Common stocks only indices have been failing to make new highs for weeks. Maybe we see 80-90 points down on SPX and then go up again, likely, or perhaps we see another quick shot down and more sideways to up until August and then the bigger decline. But today's rally was important for how ridiculously divergent it was, imho.
I think the correction in early 2016 was significant and it reset the long term breadth and delays any bear market until 2018 or so in my measures. I expect a low by 2020, but not the top of the secular bull market. Perhaps a test of SPX 1570-1600, maybe not...
I am less interested in the big picture (secular) right now as I think it is up for another decade at least, but the short term volatility is notably increasing for a cyclical low over the next 3 years. I am looking at the current excess in the markets and I think we have 12-18 months of sideways topping with sharp rallies and then a significant corrective decline for 12 months (big correction, not secular bear).
The volatility is just picking up now, but I think the crowd is really out of the markets, so the distribution may have a long time to go and it means sharply higher prices to attract their attention. They can finally look at almost a decade long bull market and buy... I guess.
See 1998-2000 and 2006-2007 as the most recent examples and those were more inflation driven markets. I think the current market is different, inflation is not the issue, the valuations are high, but I don't believe we have a pending debt bubble to pop. There are more growth and less inflationary (reflation) characteristics to this market.
This is why I think we are in secular bull and I have had this view since 2012 or so. So don't take my writings as a capitulation, by that metric I capitulated about 5 years ago, I expect a secular bull market until 2030... lol
Best of luck!

Better decline appears close
Started by
arbman
, May 25 2017 04:41 PM
21 replies to this topic
#2

robo
-

- Traders-Talk User
- 1,217 posts
Member
Posted 27 May 2017 - 07:45 AM
" “There is only one side to the stock market; and it is not the bull side or the bear side, but the right side” Jesse L. Livermore
#3
SilentOne
-

- Traders-Talk User
- 3,452 posts
Member
Posted 28 May 2017 - 06:59 AM
arbman,
Excellent comment on the markets and very timely. The period of 2011/2012 was the transition to a secular bull for US markets in my opinion as well. But with really stretched valuations today we have a good 3 year period of volatility ahead and likely low returns. The best of the larger cycles off the 2009 lows should be rolling over as markets digest this very strong bull.
cheers,
john
"By the Law of Periodical Repetition, everything which has happened once must happen again and again and again-and not capriciously, but at regular periods, and each thing in its own period, not another's, and each obeying its own law ..." - Mark Twain
#4
arbman
-
- Traders-Talk User
- 19,504 posts
Quant
Posted 29 May 2017 - 01:22 AM
Thank you Robo and John.
Here are the common stock only indices and their momentum, these are weak since March (compare to 2015):
Common stock only NYSE A-D line: this has failed to print a new high last week --distribution;
Common stock only NYSE volume A-D line: this has also failed to advance with the large cap indices last week --heavy distribution;
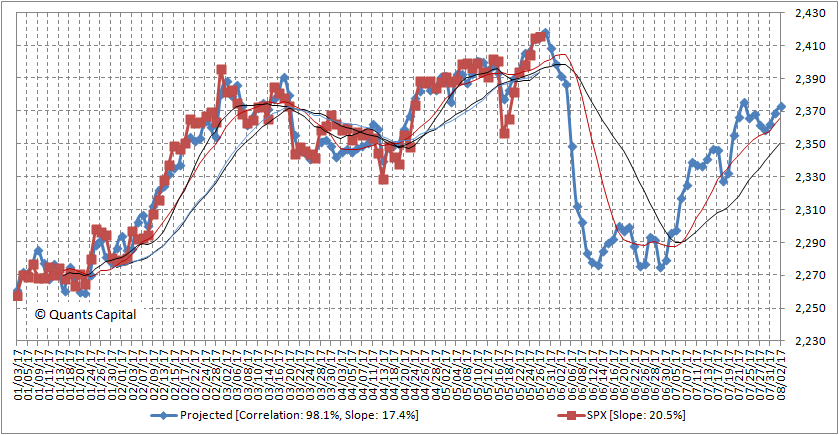
Here's my 16,000 (sixteen thousand) data point analysis, I posted here what context the system is picking up. The markets managed to advance further in all of these except for 2007 (low odds);
Basically, I have two projections, both of them point out potentially a little further rally near SPX 2420. Then a decline has a serious correction potential to the multi year trend line of 2014-2015 tops (not shown) around SPX 2280.
First one begins gradually. You see a sneaky drop by the end of next week to SPX 2395 support, or merely 20 points, I think we will see the crowd piling up on the calls and then the operators may pull the carpet under them...
The second one is a clean cut to 50 dma, and then stair steps down much lower;
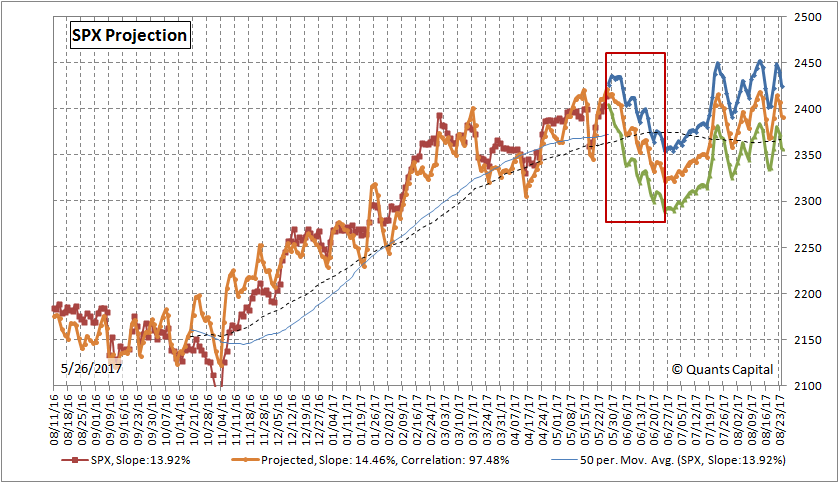
I still see the year closing up!
Disclaimer: I don't time the markets, I only manage risk, use these at your own risk.
Edited by arbman, 29 May 2017 - 01:23 AM.
#5
alexnewbee
-

- Traders-Talk User
- 1,459 posts
Member
Posted 29 May 2017 - 02:59 AM
Thank you Arbman. Nice analysis.
Fits my scenario as well. Although I am not so sure about new high in Aug.
To me it looks like 1937 more or less.
"we do G.d's work" Lloyd Blankfein
#6
SilentOne
-
- Traders-Talk User
- 3,452 posts
Member
Posted 29 May 2017 - 07:13 AM
Hurst principle of commonality across stock market indices. Helps to clarify phasing.
http://forum.hurstcy...0-uk-eod/439/20
http://forum.hurstcy...0-uk-eod/439/20
"By the Law of Periodical Repetition, everything which has happened once must happen again and again and again-and not capriciously, but at regular periods, and each thing in its own period, not another's, and each obeying its own law ..." - Mark Twain
#7
cycletimer
-
- Traders-Talk User
- 2,622 posts
Member
Posted 29 May 2017 - 07:30 AM
It's great seeing your post Arb. Like you I hardly ever post anymore and like you I augment my returns with credit spreads. I used to look way out with cyclic analysis as you have done (year 2020) bit these days I take it one month at a time.
#8
arbman
-
- Traders-Talk User
- 19,504 posts
Quant
Posted 29 May 2017 - 12:24 PM
Thank you Arbman. Nice analysis.
Fits my scenario as well. Although I am not so sure about new high in Aug.
To me it looks like 1937 more or less.
Thank you Alex, but I don't have a reason to believe that the secular cycles have changed significantly.
I had a post on this board about 100+ year analysis about cycles, it was also my conclusion that the worst bear (secular) market was going to end also around 2012.
We even got a US govt bond downgrade in 2012 after the rescue of the banking from 2009 until 2011 with QE. I think they threw everything to this market including the kitchen sink.
The last bear and the debt accumulated since 2009 have will impede the future growth, but this country is still growing. I am less worried about the debt as long as the growth remains in place with mild inflation.
See this tweet:
https://twitter.com/...621881036582912
I think the biggest secular threat to growth is the peak population in 2040-2050s as the inflation will simply become unsustainable (like in Japan).
The cycles show that there will be another secular bear starting from 2030s. However, there may not be another chance to inflate the markets like the US government did during the last crisis. These may fundamentally change how we look at the markets, but markets will be still here and we have decades to go until we get there. US is resource rich and its population is still growing...
Nice to see you too cycletimer...
Best of luck out there...
#9
alexnewbee
-
- Traders-Talk User
- 1,459 posts
Member
Posted 29 May 2017 - 12:45 PM
Thank you again, Arman.
Here is good read on Eurodollar system and why it is broken now.
http://www.alhambrap...rs-soul-part-2/
Here is good read on Eurodollar system and why it is broken now.
http://www.alhambrap...rs-soul-part-2/
"we do G.d's work" Lloyd Blankfein
#10
arbman
-
- Traders-Talk User
- 19,504 posts
Quant
Posted 29 May 2017 - 02:52 PM
BTW, the topic title should've said "Worse Decline Appears Close", there is nothing better about a market decline. 


