armstrong's chart above is for the sovereign debt default cycle which is related to why the dow keeps going up as confidence in government is declining.
who told you all that

Member

Posted 06 August 2017 - 07:56 PM
armstrong's chart above is for the sovereign debt default cycle which is related to why the dow keeps going up as confidence in government is declining.
who told you all that
Member

Posted 07 August 2017 - 09:13 AM
Much of the sovereign debt has been offloaded by the banks.
http://wolfstreet.co...-all-bad-banks/
The EU's debt-to-gdp ratio has fallen to 2 percent, which is sustainable. The ECB will stop buying securities.
If there is a crisis of some sort, it is because the US will start to issue debt again and the estimate is for a deficit of 850 billion dollars next year. Together with the 600 billion dollars that needs to be auctioned off once the debt ceiling is reset, there will not be enough central bank buying to absorb the supply from the US, EU, and Japan.
Member

Posted 07 August 2017 - 04:16 PM
armstrong's chart above is for the sovereign debt default cycle which is related to why the dow keeps going up as confidence in government is declining.
who told you all that
Armstrong himself said that, as fear grows of government default on their bonds capital is attracted to private equity, eventually the whole government debt mess is going to 'crash and burn' in he and his computer model's view. . You have had false information on your silicon investor site about Armstrong for years btw, he has been predicting 23,000 dow since at least 2011 which was his second target, after that he thinks 40k as I said. Obviously his chart from 1979 predicting a phase transition by 2009 is bang on, nobody else saw that far ahead. It is all part of his pi cycle model, the 51.6 year cycle does not peak until 2032.95 which is a 'confidence in private markets' cycle and the bigger 309.6 year cycle (6 x 51.6) peaks in 2032.95 as well which he thinks will mark the peak of the big government era after that we are headed for the biggest depression in hundreds of years, a hangover from the Marxist era where government thinks it is just fine to go into massive debt, take near 50% of gdp in taxation etc.
Edited by Russ, 07 August 2017 - 04:24 PM.
Member
Posted 07 August 2017 - 06:28 PM
armstrong's chart above is for the sovereign debt default cycle which is related to why the dow keeps going up as confidence in government is declining.
who told you all that
Armstrong himself said that, as fear grows of government default on their bonds capital is attracted to private equity, eventually the whole government debt mess is going to 'crash and burn' in he and his computer model's view. . You have had false information on your silicon investor site about Armstrong for years btw, he has been predicting 23,000 dow since at least 2011 which was his second target, after that he thinks 40k as I said. Obviously his chart from 1979 predicting a phase transition by 2009 is bang on, nobody else saw that far ahead. It is all part of his pi cycle model, the 51.6 year cycle does not peak until 2032.95 which is a 'confidence in private markets' cycle and the bigger 309.6 year cycle (6 x 51.6) peaks in 2032.95 as well which he thinks will mark the peak of the big government era after that we are headed for the biggest depression in hundreds of years, a hangover from the Marxist era where government thinks it is just fine to go into massive debt, take near 50% of gdp in taxation etc.
bang on....not
http://princetonecon...ot.com/2007/01/
.
Member
Posted 08 August 2017 - 08:56 AM
It is worth watching to see if there will be selling in front of the debt ceiling agreement which always goes down to the last hour. The last two deadlines in February 2014 and November 2015 were preceded by 5 and 11 percent declines, respectively.
Member
Posted 08 August 2017 - 11:47 AM
armstrong's chart above is for the sovereign debt default cycle which is related to why the dow keeps going up as confidence in government is declining.
who told you all that
Armstrong himself said that, as fear grows of government default on their bonds capital is attracted to private equity, eventually the whole government debt mess is going to 'crash and burn' in he and his computer model's view. . You have had false information on your silicon investor site about Armstrong for years btw, he has been predicting 23,000 dow since at least 2011 which was his second target, after that he thinks 40k as I said. Obviously his chart from 1979 predicting a phase transition by 2009 is bang on, nobody else saw that far ahead. It is all part of his pi cycle model, the 51.6 year cycle does not peak until 2032.95 which is a 'confidence in private markets' cycle and the bigger 309.6 year cycle (6 x 51.6) peaks in 2032.95 as well which he thinks will mark the peak of the big government era after that we are headed for the biggest depression in hundreds of years, a hangover from the Marxist era where government thinks it is just fine to go into massive debt, take near 50% of gdp in taxation etc.
bang on....not
http://princetonecon...ot.com/2007/01/
.
that is my site you have linked to, I created it to help Armstrong when the government was going after him.. what is your point? there is a great deal of information on the site. Baron's also quoted him around 2011 in which he predicted the dow was going to have a huge bull run. nobody is perfect in this business and that includes you, in early 2007 I posted a chart on this site - see below - which predicted the housing market was going to form a big low in the spring of 2009, you told Rodgerdodger back then that the housing problem was no big deal.
Member
Posted 08 August 2017 - 04:10 PM
https://www.cxoadvis...rtin-armstrong/
Not very useful. People claim his turning points invert. Cycles don't invert, They have lengths that can elongate or truncate, The standard cycle length is a guide, not a fixed parameter. He also claims there will be a panic and a blowoff. His prediction is looking for both a big selloff and a big rally. Again, the reader is left to interpret it in the way he wishes. We see this often with people who claim to use astrology, cycles, waves, and so on.
Member

Posted 08 August 2017 - 05:18 PM
https://www.cxoadvis...rtin-armstrong/
Not very useful. People claim his turning points invert. Cycles don't invert, They have lengths that can elongate or truncate, The standard cycle length is a guide, not a fixed parameter. He also claims there will be a panic and a blowoff. His prediction is looking for both a big selloff and a big rally. Again, the reader is left to interpret it in the way he wishes. We see this often with people who claim to use astrology, cycles, waves, and so on.
Member
Posted 09 August 2017 - 07:40 AM
https://www.cxoadvis...rtin-armstrong/
Not very useful. People claim his turning points invert. Cycles don't invert, They have lengths that can elongate or truncate, The standard cycle length is a guide, not a fixed parameter. He also claims there will be a panic and a blowoff. His prediction is looking for both a big selloff and a big rally. Again, the reader is left to interpret it in the way he wishes. We see this often with people who claim to use astrology, cycles, waves, and so on.
Armstrong's pi cycle economic confidence model has a statistical correlation to the market in the billions to one odds, many dates have seen highs or lows in major indices to the day. ...
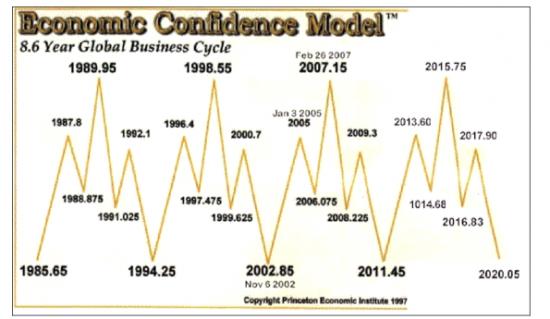
1981 saw a huge spike in inflation with Gold hitting US$850 per ounce was predicted by Armstrong in the 1970's, that time period was also the final wave of the last 51.6 year confidence in public sector cycle (FDR's New Deal Era) leading up to the new private wave that started in 1985.65 which will end in 2037.
1985.65 (.65 of the number of days in the year) - start of the current 51.6 year private cycle - was the major turn in the British Pound/Us dollar ratio.
1987 date was the low in the US stock markets crash to the day. The model predicted the crash of 1987 to the day during which time Martin Armstrong indicated that it was not the start of the next great depression as some said, but was just the first serious panic in the emerging new private wave.
1989 cycle date was the high in the Japanese Nikkei and Martin Armstrong warned that it was going to go down 20,000 points within 10 months.
1994.25 showed the low in the SP500 to the day and the start of the dot.com mania of the 1990's.
1996 turn showed the high in the US markets at that point.
1998.55 was the high in the US stock markets to the day and led to a 20% panic sell-off and a crisis with a derivatives company which the government stepped in to save. Mr Armstrong predicted this would be a major event almost a decade before it happened! It was also the real peak in the markets as measured internally. His computer had forecast in the early 1990's that the dow would hit 6,000 by 1996 and 10,000 by 1998, the computer model had lots more in it than just the pi cycle.
1999.62 was the low in the Gold price after a 20 year bear market.2000.7 was the final high in the SP500 for the roaring 1990's bull market.
Sept.2000 saw the final high in the SP500 for the great 1990's bull market that Martin had forecast accurately a decade before. Martin predicted the markets would go sideways for 5 or 6 years after the 1990's bull market came to an end. A little more than 6 years later in early 2007 the Dow Jones made new highs.
2002.85 was the end of the bear market in the US stock exchanges, as Martin had forecast. It was also a bigger cyclical trend for rising commodity markets which Martin had forecast long before. One other thing happened on that cycle of November 8, 2002, it was the day that the UN handed down its ultimatum to Iraq to comply with its demands, not long after President George W. Bush invaded Iraq on a false charge that Iraq had weapons of mass destruction, refusing to let the UN do its job of inspections, even though the UN protested. Martin had forecast that war would increase after this turning point, although he thought it would increase with China and Russia trying to hold onto past glory with their satellites. In general Armstrong thought that this part of the cycle led to increased war which was and unfortunately, is correct.
In an article he wrote in 1999 he warned that the USA would be attacked in either Sept. or Oct. of 2001 (probably based on the 224 yr. civilization cycle which is related to the Pi Cycle) and that this would then be followed by a war in response to the attack, it all came to pass unfortunately. Very strange.
2005 turn saw a low in the US dollar index with a sharp reversal to the upside.
2007.15 In general the model indicated that everything would inflate again after the 2002 low, with an emphasis on hard assets - commodities, real estate etc. The Schiller Housing index peaked on the Feb. 2007 Pi Cycle date, as did the Nikkei and the Financial Indices)
Edited by Russ, 09 August 2017 - 07:42 AM.


